The Advantages Of
Control Charts
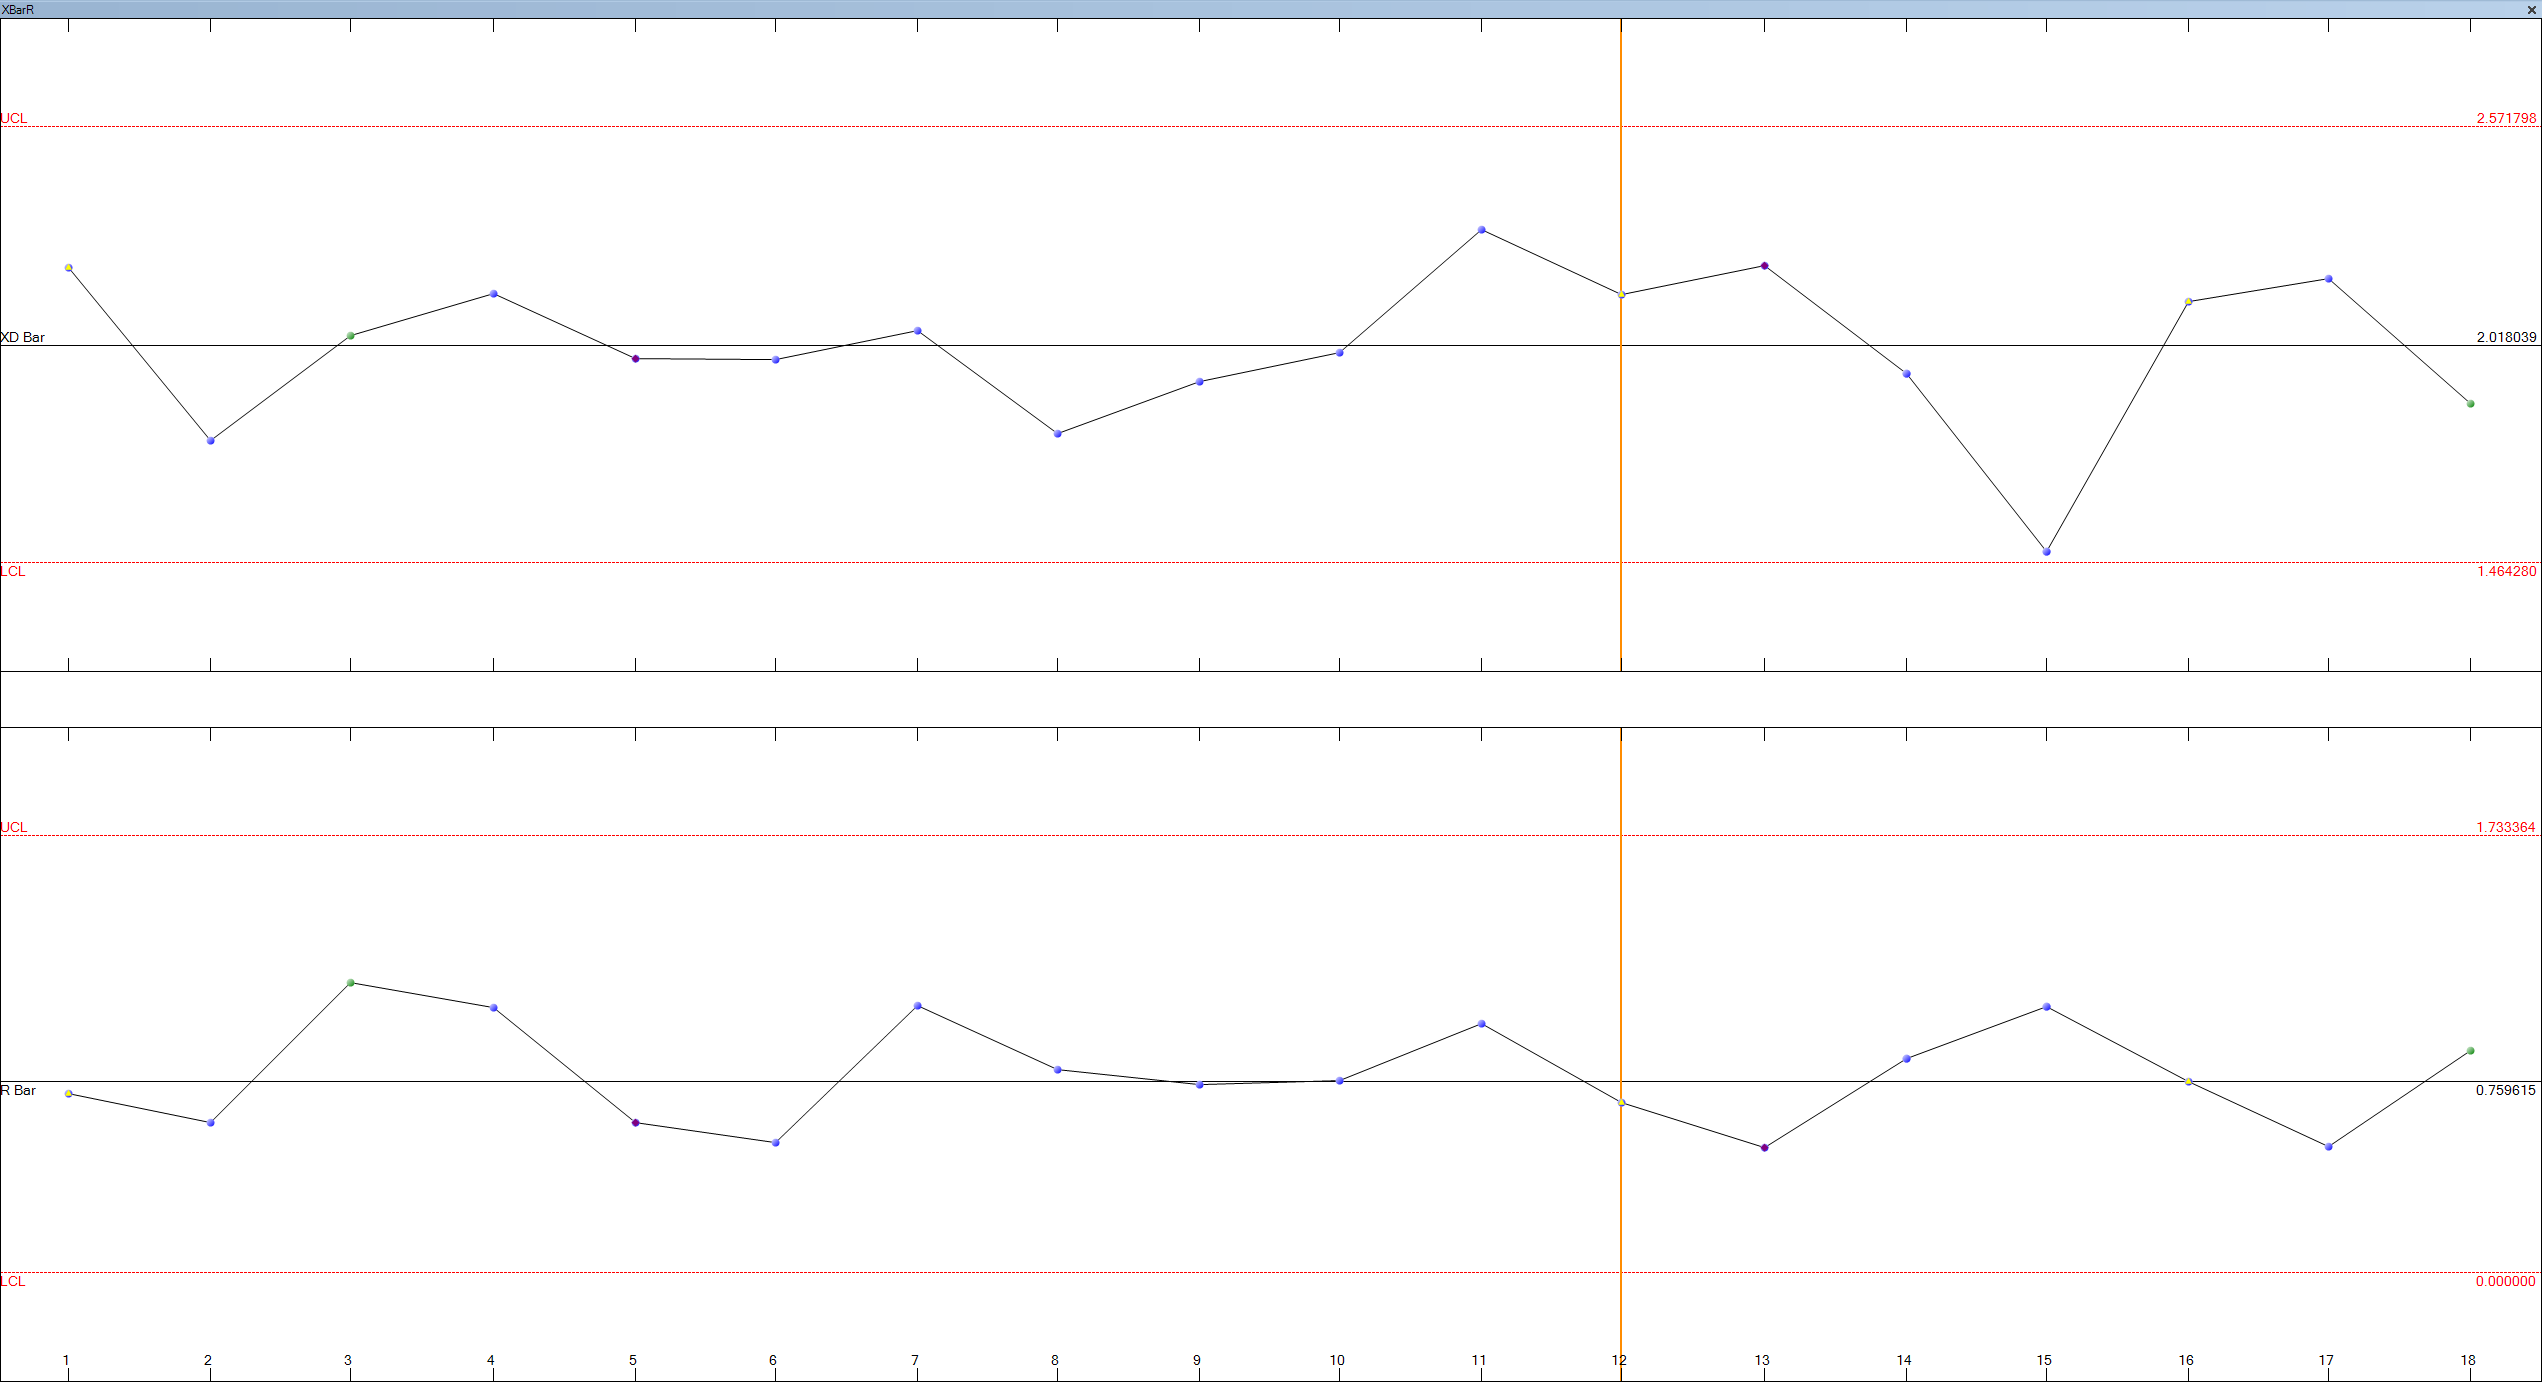
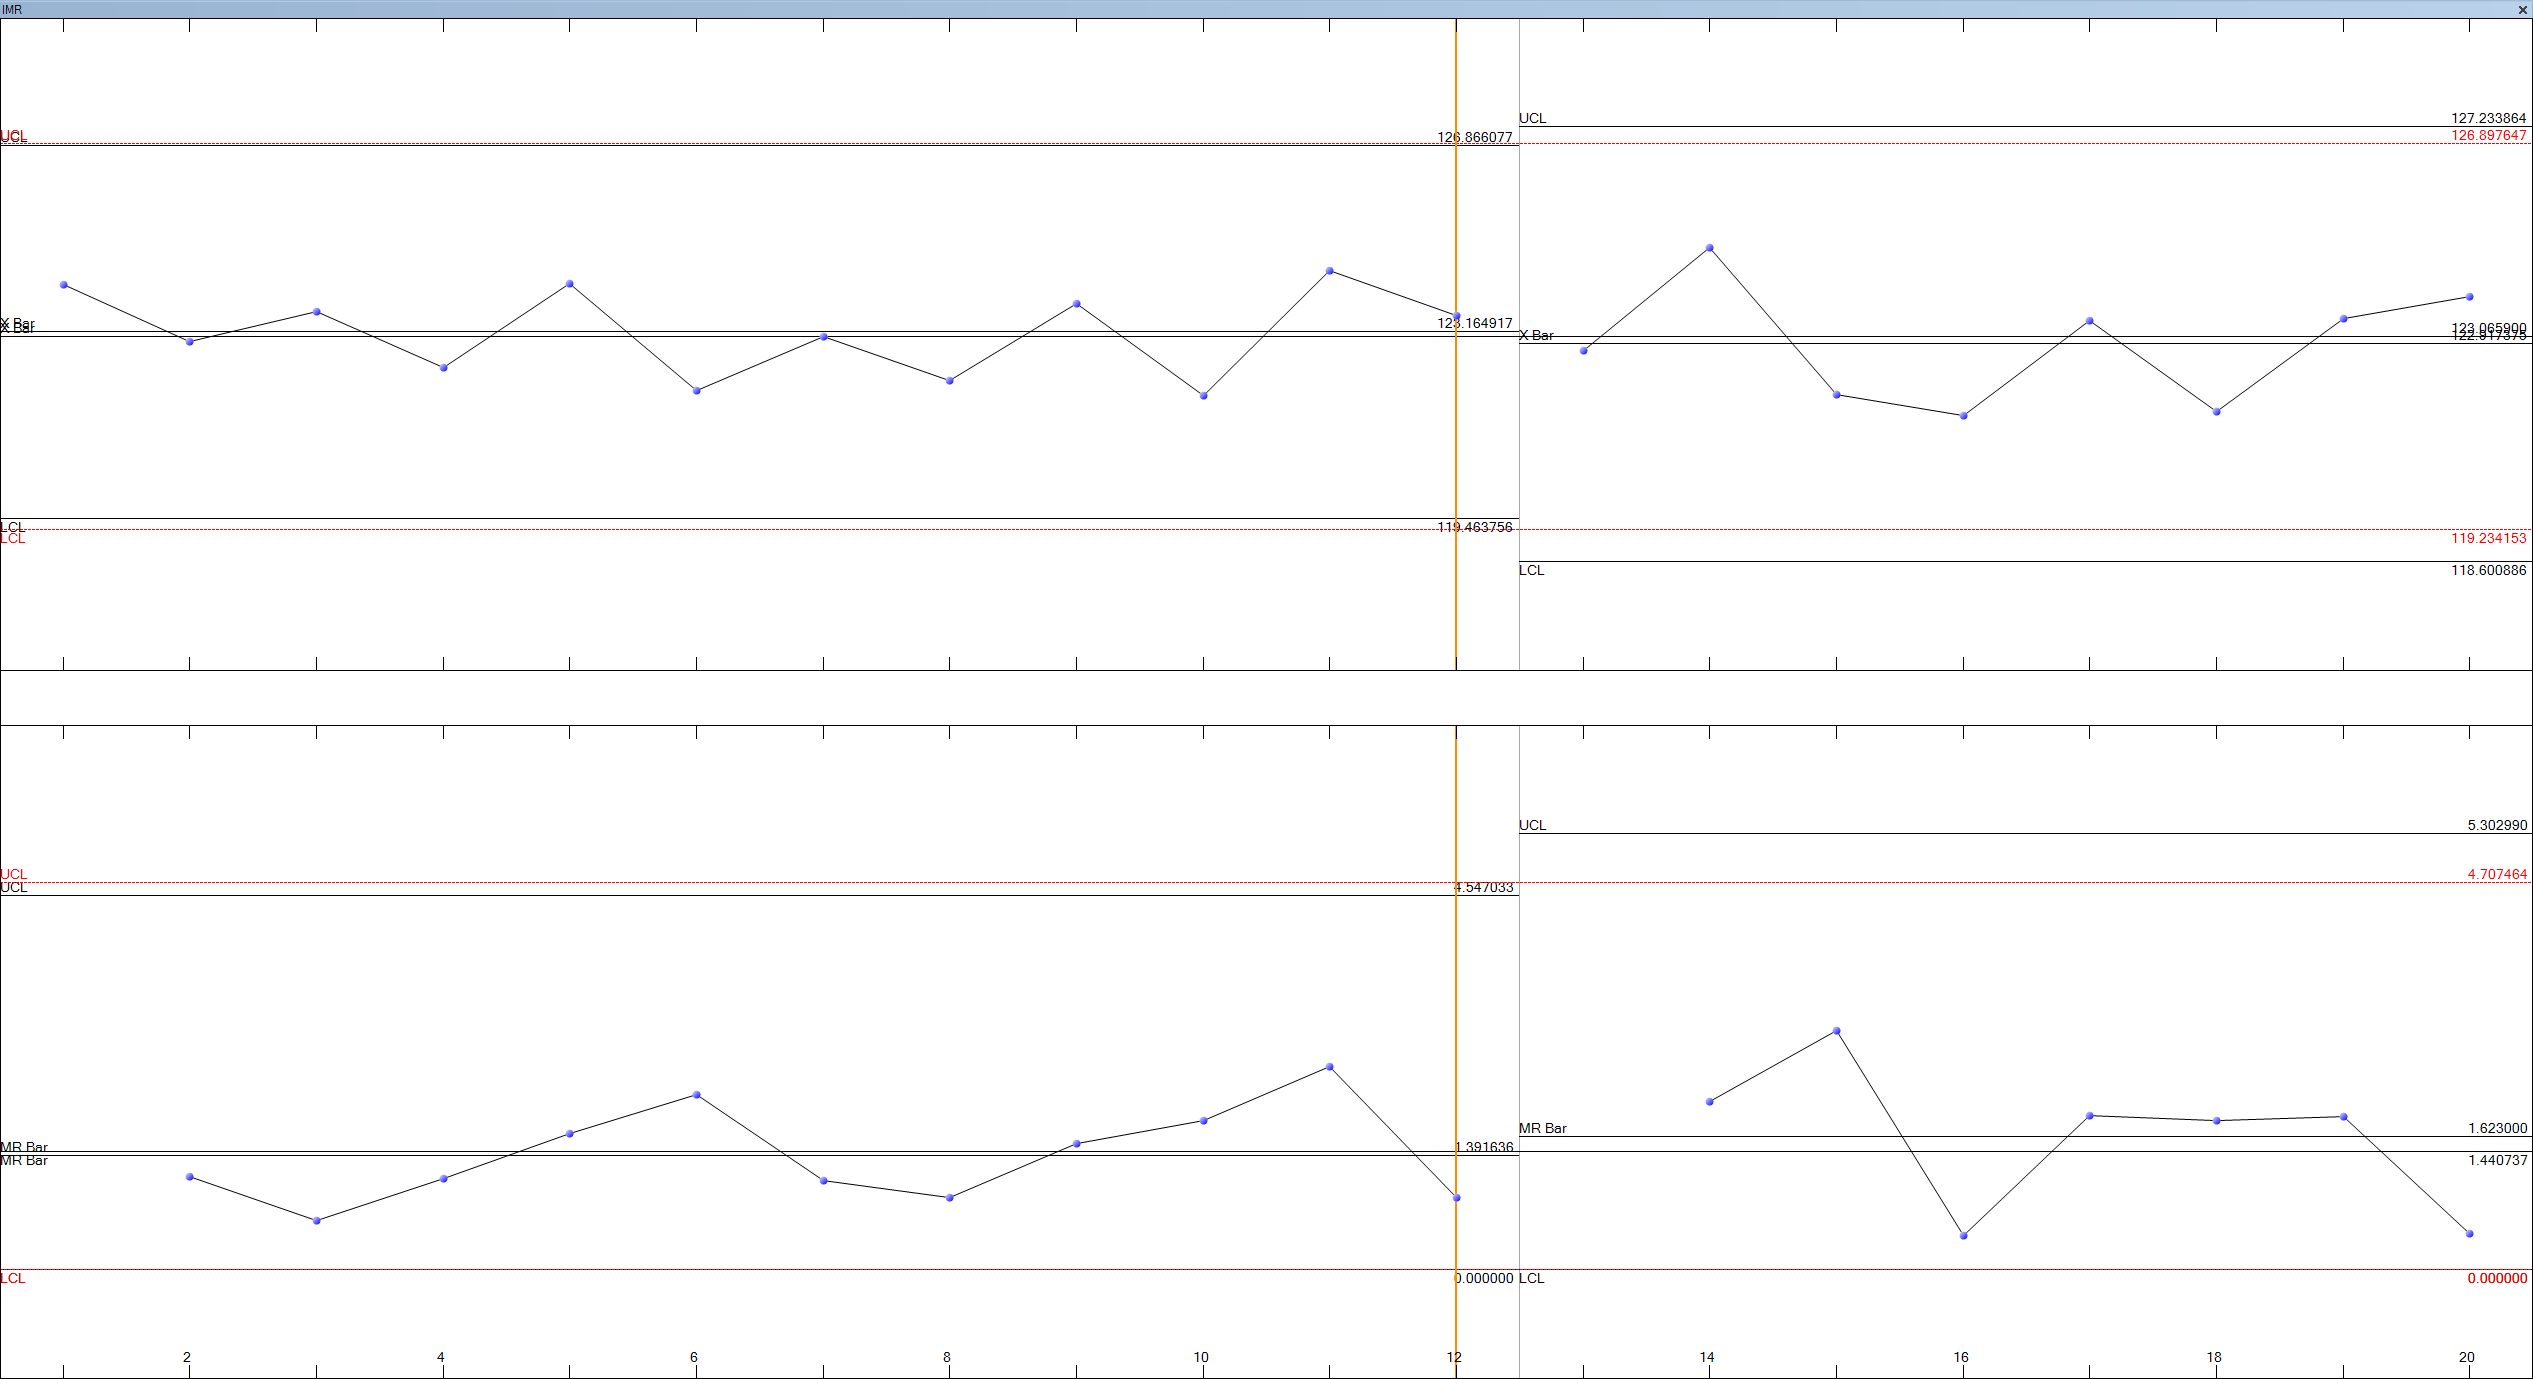
These charts are particularly helpful for machine dominant processes. The X-bar (mean) chart tells when a change has occurred in central tendency. This might be due to such factors as tool wear, a gradual increase in temperature, a new batch of material of greater toughness, or a different method by a night-shift workman. In looking for causes when an R (range) chart is out of control, look for poor repair or poor maintenance if this is a machine controlled process. Look for new operators or something disturbing the operators if this is an operator controlled process.
Explore All Products


