Run Charts

The run chart is not considered a Shewhart control chart and it is the least powerful of all the charts. This chart does, however, have a place.

What is a Run Chart?

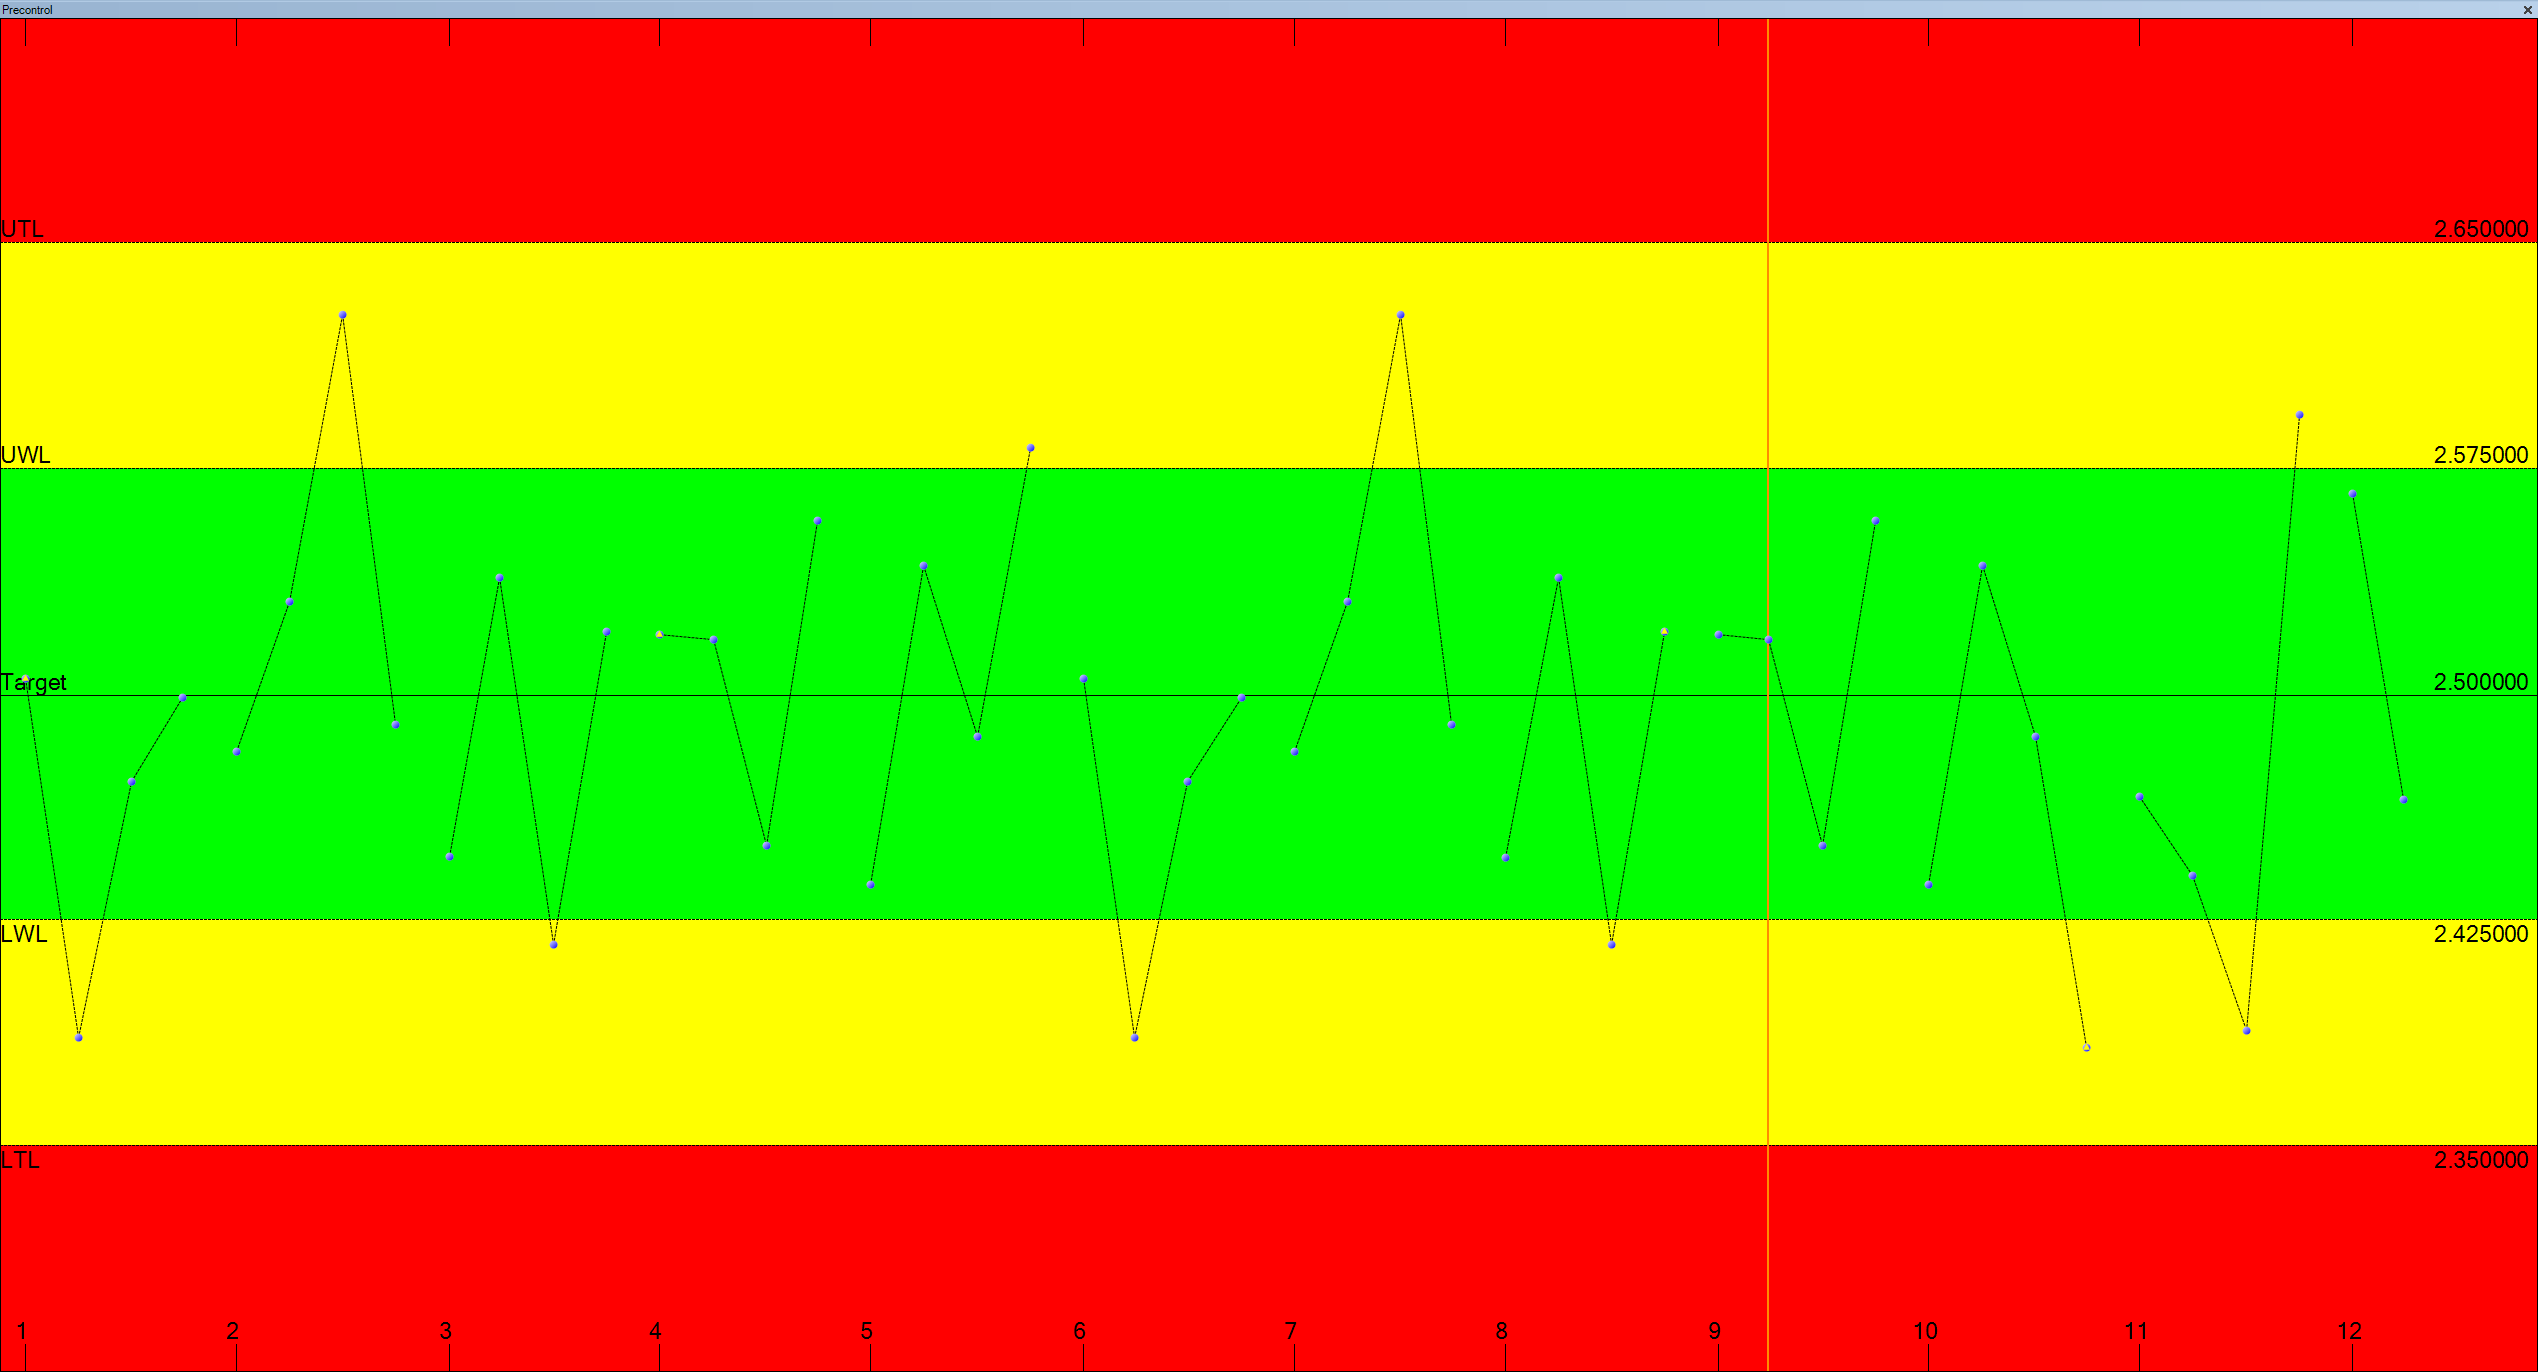
In many cases it is a good idea to start out by charting a process with this tool before applying a more powerful control chart. It will allow the user to remove inconsistencies that occur over time. A control chart might obscure some important information by averaging it out. The pre-control chart uses a technique known as “Stop Light Gaging” or “Zone Pre-Control”.

  • The green zone prompts the user to continue the run (within tolerance state) with the acceptable observations that fall within this region.

  • The yellow zone prompts the operator to use caution (near out of tolerance state) and look for possible problem causes.

  • The red zone prompts the operator to stop the run (out of tolerance state) and determine the cause before starting the process again.

Tier chart is a good way to view the data emphasizing the range and location of measurements within a subgroup, relative to tolerance limits.

The pre-control chart uses a technique known as “Stop Light Gaging” or “Zone Pre-Control”.

Run Charts allow the user to remove inconsistencies that occur over time without the obscurity that a control chart might hide by averaging data values.