Given: Engineering Specifications = 60 ± 5; USL = 65, LSL = 55

 s=2.3232
Since Cp depends on the unknown value of , we will use an estimate of
(which is s) to estimate Cp.
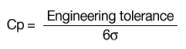
Step 1: Calculate the engineering Tolerance.
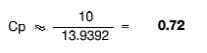
Engineering tolerance is 65 – 55 = 10
Step 2: Estimate capability.
Process capability = 6 6s = 6 x 2.3232 = 13.9392
Step 3: Estimate Cp.
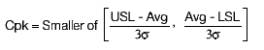
Step 4: Estimate Cpk.
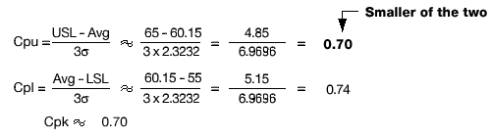
Given: Engineering specifications = 60 ± 5; USL = 65, LSL = 55.
Avg = 60.15
s=2.3232
Calculating Cpk for Specific Cases:
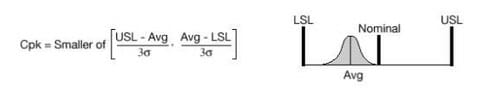
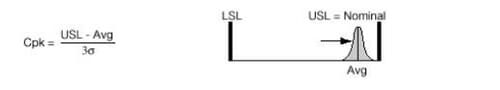
Case 1: Upper and lower specifications are provided and engineering nominal (or target) is centered between the specification limits.
Case 2: A lower physical bound is used as the lower specification limit, or no lower specification exists. It is assumed that smaller feature measurements are always superior to larger values.

Case 3: An upper physical bound is used as the upper specification limit, or no upper specification exists. It is assumed that larger feature measurements are always superior to smaller values.

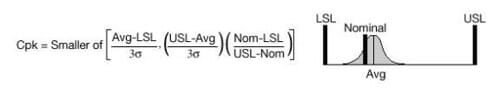
Case 4: Upper, lower, and engineering nominal (or target) specifications are given, but nominal is closer to the lower specification than the upper specification.
Cpk is maximized when the process average equals the nominal specification. Cpk is positive when the process average lies between the upper and lower specification limits, and is 0.0 when the process average equals either LSL or USL. When nominal is not centered between the upper and lower specification limit, a higher Cp is required to meet a Cpk of 1.33 than if the nominal had been centered.
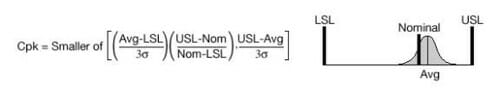
Case 5: Upper, lower, and engineering nominal (or target) specifications are given, but nominal is closer to the upper specification than the lower specification. Cpk is maximized when the process average equals the nominal specification. Cpk is positive when the process average lies between the upper and lower specification limits, and is 0.0 when the process average equals either LSL or USL. When nominal is not centered between the upper and lower specification limit, a higher Cp is required to meet a Cpk of 1.33 than if the nominal had been centered.
Case 6: Upper, lower, and engineering nominal (or target) specifications are given, but the nominal is equal to the lower specification limit and there are no physical bounds limiting measurements from going below nominal.
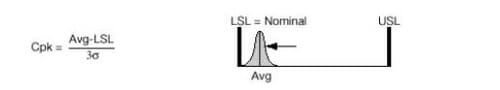
For this case and the following case only, a large Cpk is not desirable. The optimal Cpk is 1.33, and Cp should be maximized instead of Cpk.
Case 7: Upper, lower, and engineering nominal (or target) specifications are given, but the nominal is equal to the upper specification limit and there are no physical bounds limiting measurements from going above nominal.
For this case and the preceding case only, a large Cpk is not desirable. The optimal Cpk is 1.33, and Cp should be maximized instead of Cpk.
When no nominal is given, a manufacturing target should be established — generally halfway between the upper and lower specifications. In such instances, use case 1, 4, 5, 6, or 7, as appropriate.
Cases 4, 5, 6, and 7 are encountered in manufacturing on a daily basis. Engineers give design guidance to manufacturers when nominal is intended to be off-centered and is so desired to achieve optimum product performance in the marketplace. Likewise, operators machining features to maximum material condition (MMC) may help to minimize scrap and add serviceable life to many high-cost parts. Therefore, it becomes advantageous for manufacturing to know and understand where to center a process on what optimum target value, and when to aggressively strive for improving Cp while holding Cpk to a relatively lower, constant index. The value of a capable measurement system cannot be overstated, especially for these cases. Gage variation studies should be performed to add confidence in accepting and rejecting process output targets close to specification limits. There are, of course, cost considerations and tradeoffs, but setting the proper capability goals can help the producer (as well as the customer) achieve superior quality and performance. Data and information feedback to Engineering and manufacturing will enhance current and future products. Along with other information, the use of statistical control charts and capability data are vital pieces of the communication process.
Note: Capability index information must be recorded. This would at least include Cpk values for key characteristics
AIAG, VDA, Ford all use the AIAG method for calculating capabilities, but they assign different labels to the values.
Below is a table of how the label names correspond to AIAG method.
| AIAG | Cp | Cpk | Pp | Ppk |
| VDA | Cp | Cpk | Cm | Cmk |
| Ford | Cp | Cpk | Pp | Ppk |
| CNOMO | CAM | CAP | Cpk |