Process Analyzer Professional
Analyze data collected on all networked Real-Time stations to identify problem areas, take corrective action, and improve the quality of your product. Inspection data can be merged, filtered, charted and printed to identify long term trends and identify root causes for process improvement.
Learn More arrow_downwardRequest DemoProduct SupportDownload Brochure

MeasurLink Process Analyzer Professional Edition is designed for viewing and manipulation of Real-Time data in a networked environment. It enables Quality Engineering to slice and dice data in meaningful ways that contribute to quality control initiatives. For larger installations that use different databases, the ability to switch the connection allows an engineer to analyze data from all sources.
Features & Benefits
Click each feature to learn more.
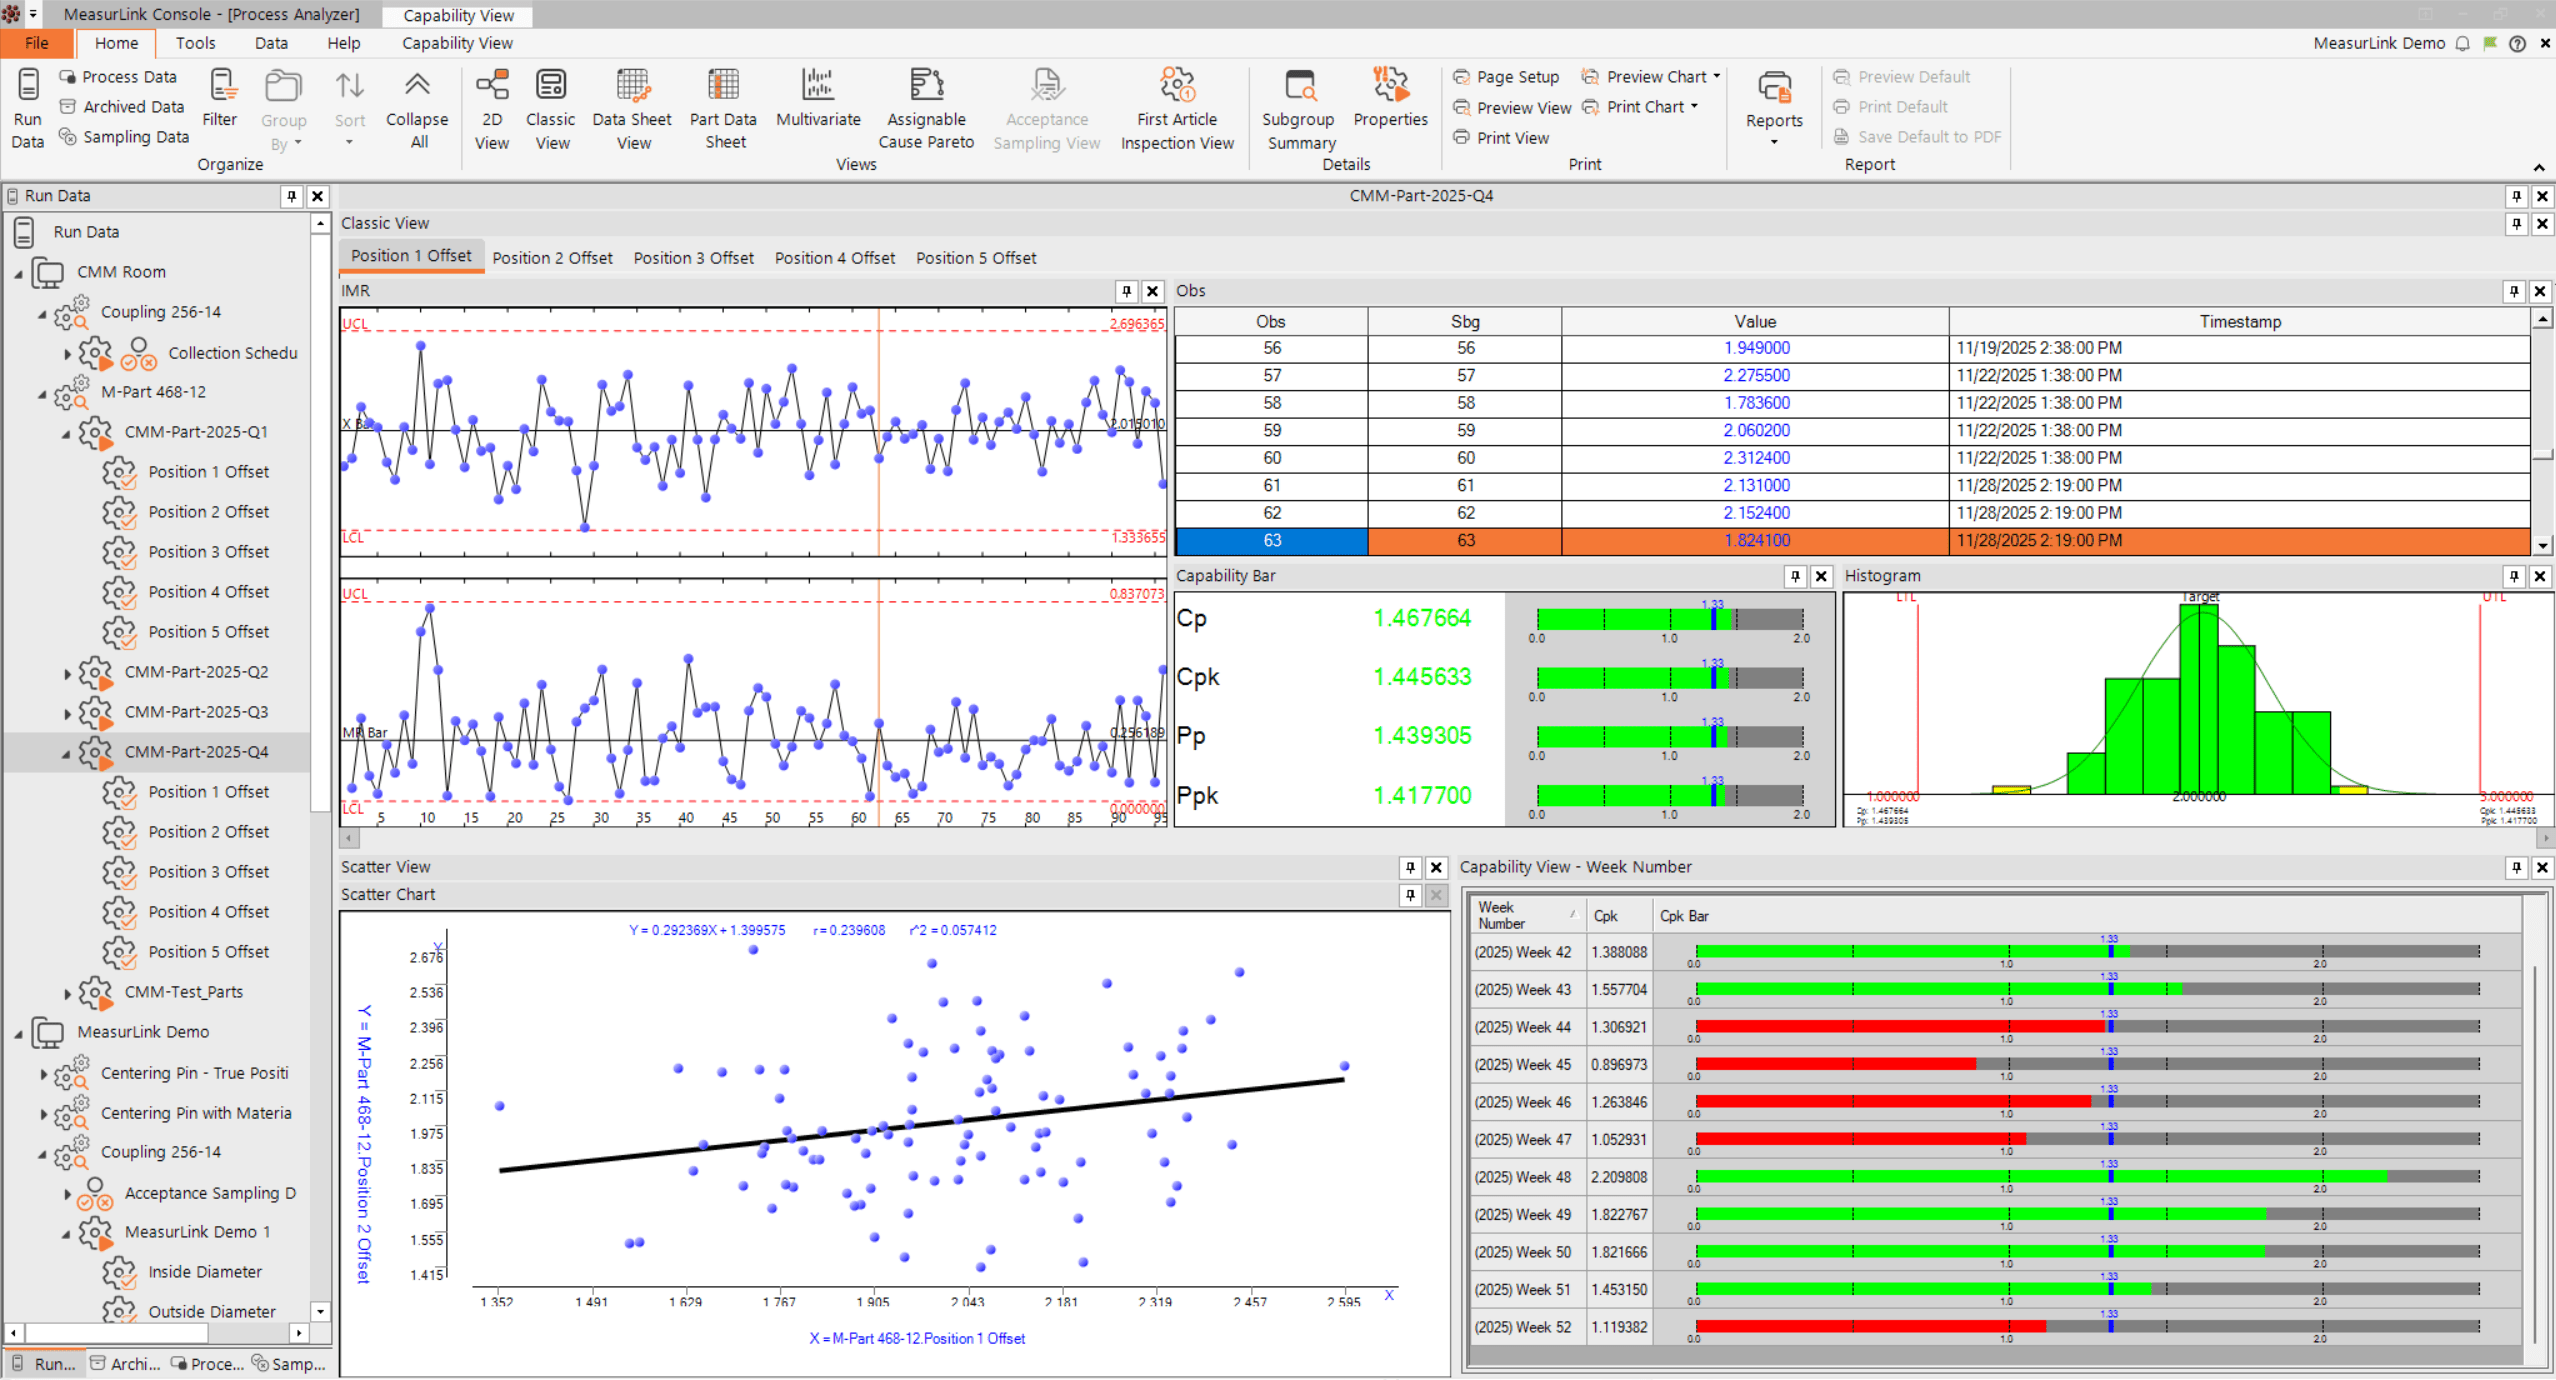
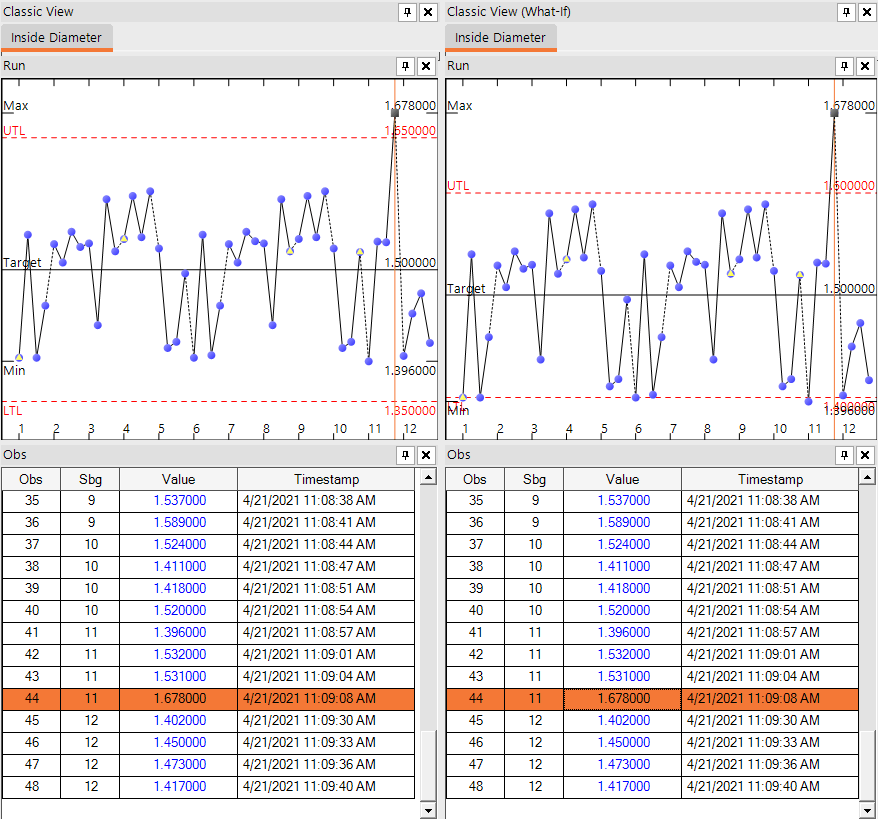
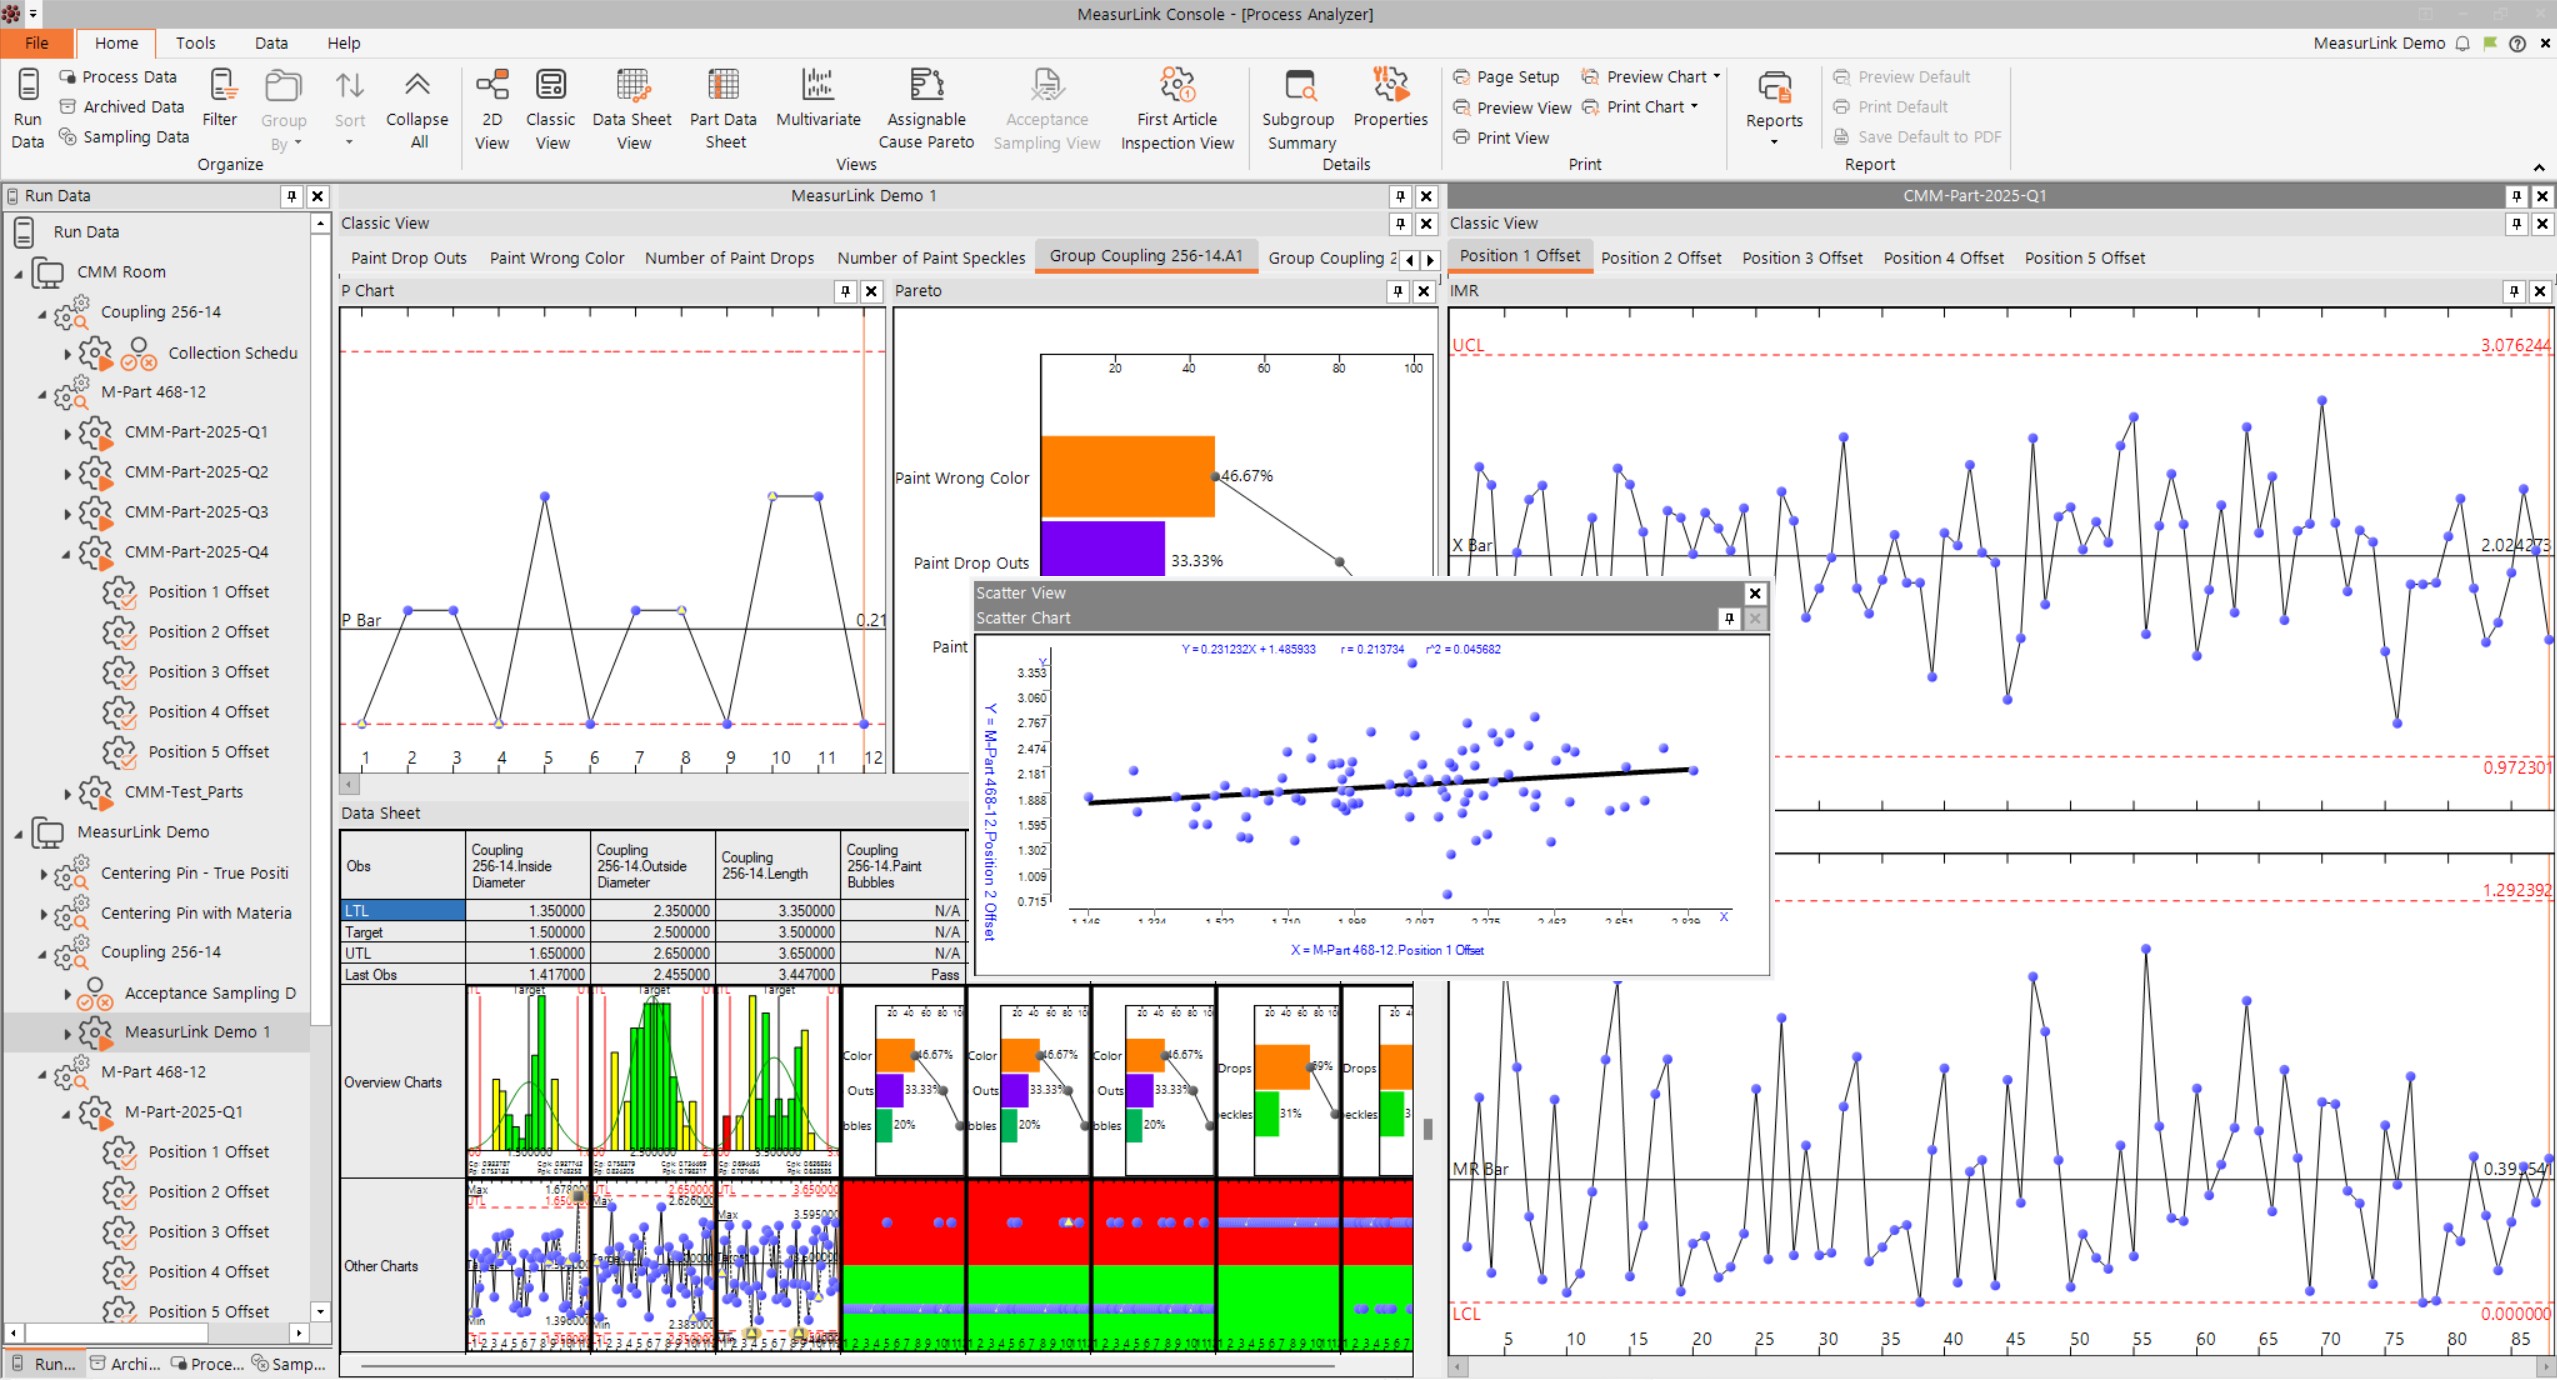
Analyze inspection data, view notes and traceability. Open data from different runs to compare the data and process behavior.
For larger installations that use different databases, the ability to switch the connection allows an engineer to analyze data from all sources.
View data by part, plan, station, year, month, day. Apply saved filters to data and search for specific traceability or serial number criteria.
Combine lot based or just in time collected data to get a bigger picture of process variation and production quality. One option available for merging is to align data by serial number.
Apply electronic signatures to your data.
Use wizard to view and print a grid with capability and statistical information.
Reporting is made easy through the use of a “what you see is what you get” style of template creation that allows you to pick chart and data through drag and drop with resizing. Several standard report templates are provided out of the box.
Perform correlation studies to identify process interactions.
Often, especially for runs containing a large volume of subgroups, requests are made for subsets of data that are further related from the entire run’s population. MeasurLink provides robust filtering capabilities to comply with these requests.
Easily view charts showing the capability of a characteristic based on the traceability, subgroup or time. Compare the capability of machines, for example. The Cpk shows green for exceeding requirements and red for failing.