Coupled with specification limits, it can tell the operator a lot about a process. The histogram gets its name from the fact that it displays historical information. The frequency distribution is plotted as side by side columns, each having equal width.
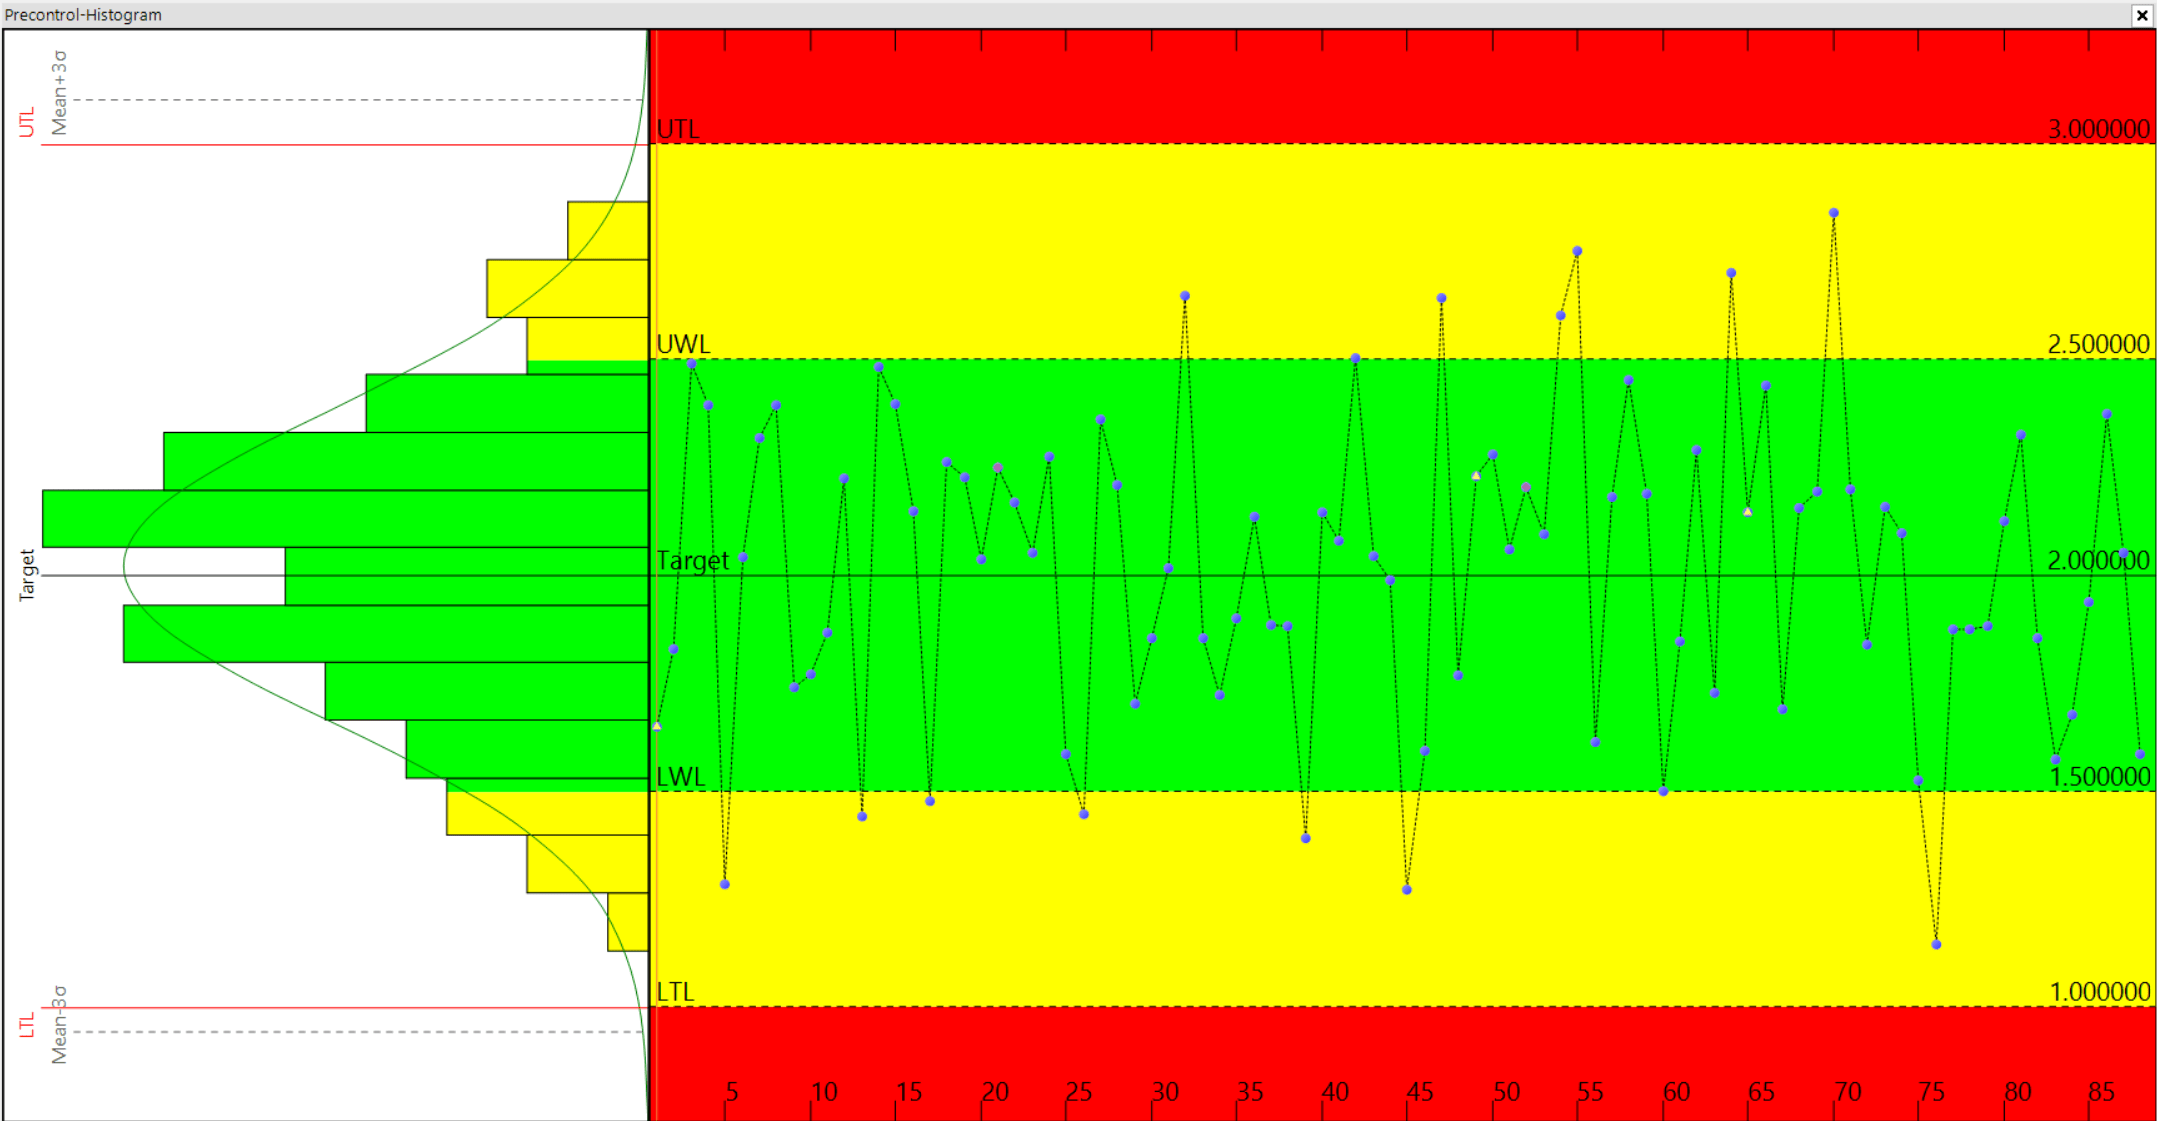
It cannot tell the operator what the process is going to do next, but it can tell the operator what it has done in the past, and getting to know the process is the first step at gaining control of it.
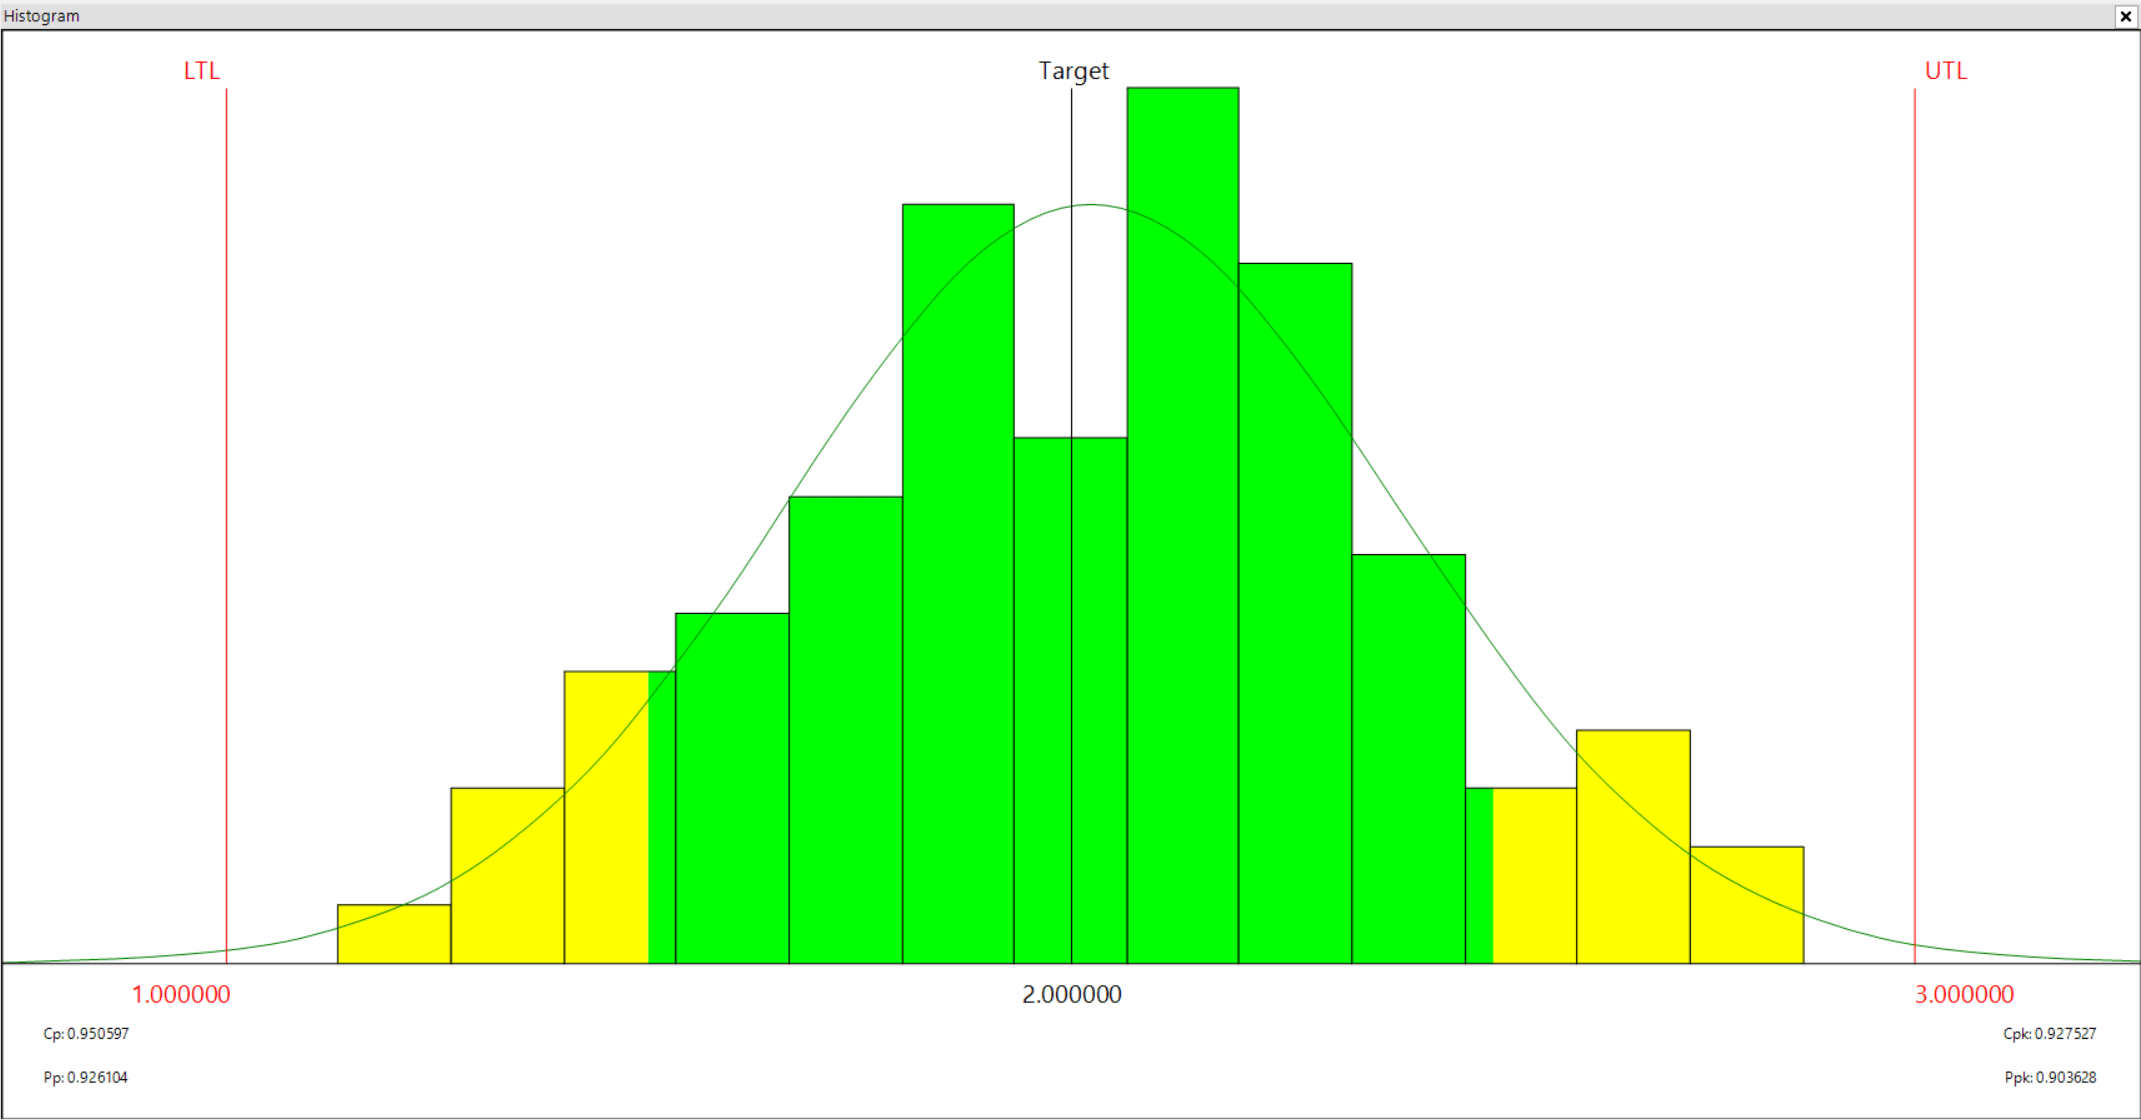
The frequency histogram is a very effective graphical and easily interpreted method for summarizing the collected data and shows the dispersion of the process. It provides information about: the average (mean) of the data, the variation present in the data, the pattern of variation and whether the process is within specifications.