It allows for tracking whether the characteristic has passed or failed, e.g. is the sticker on? Any fail also makes the part defective. It is typically used with go no-go requirements.
Used to track the number of defects on a characteristic, e.g., number of scratches. The user determines when the part is defective.
Count the number of defects on a characteristic in random order at any time during the plan based on sample size. The user determines when the part is defective.
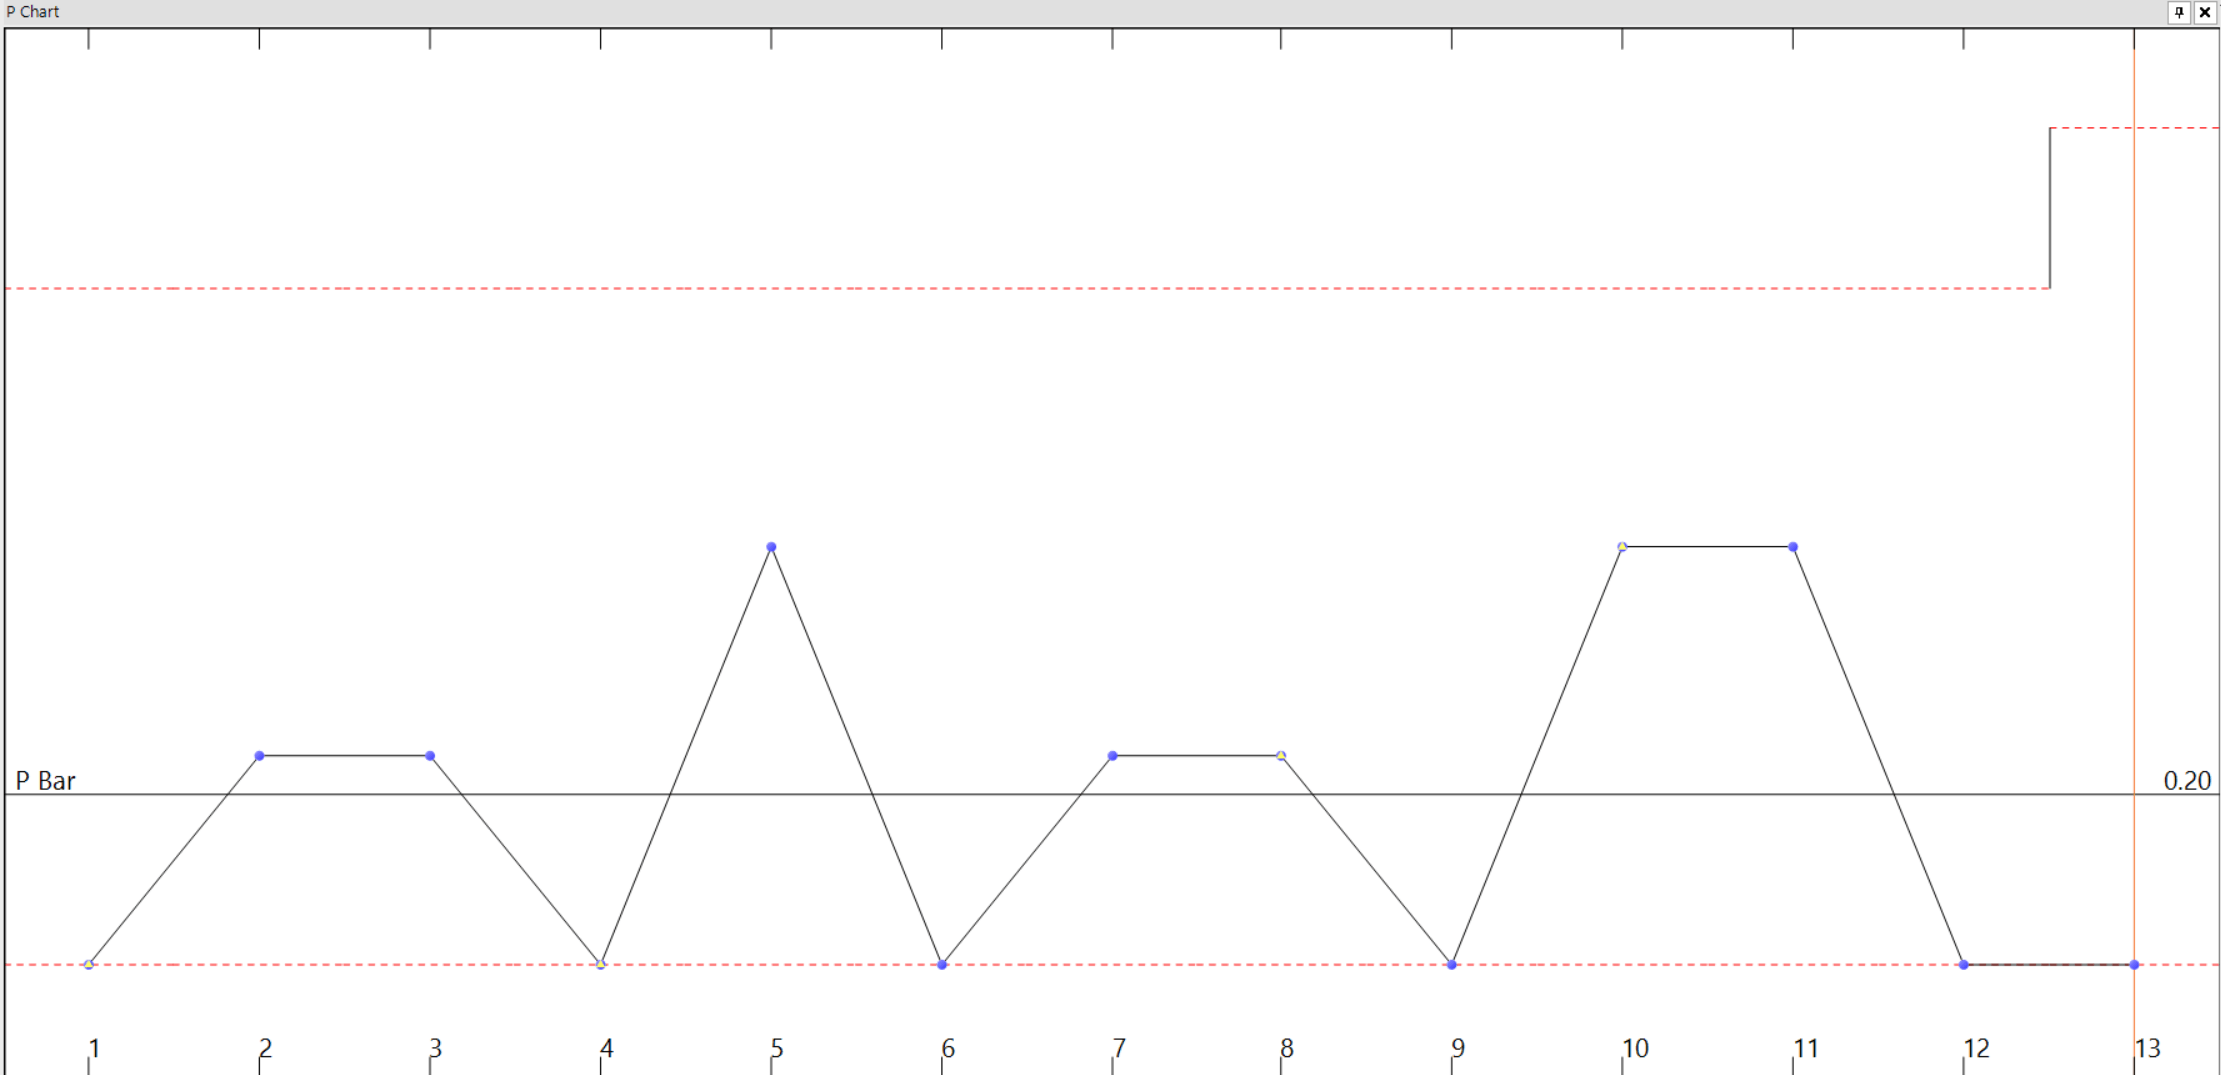
The most commonly used attribute control chart is the p chart. The p chart is used specifically to control the fraction or proportion non-conforming. The fraction non-conforming is the ratio or the quantity non-conforming divided by the quantity of parts. The p chart is used for several reasons:
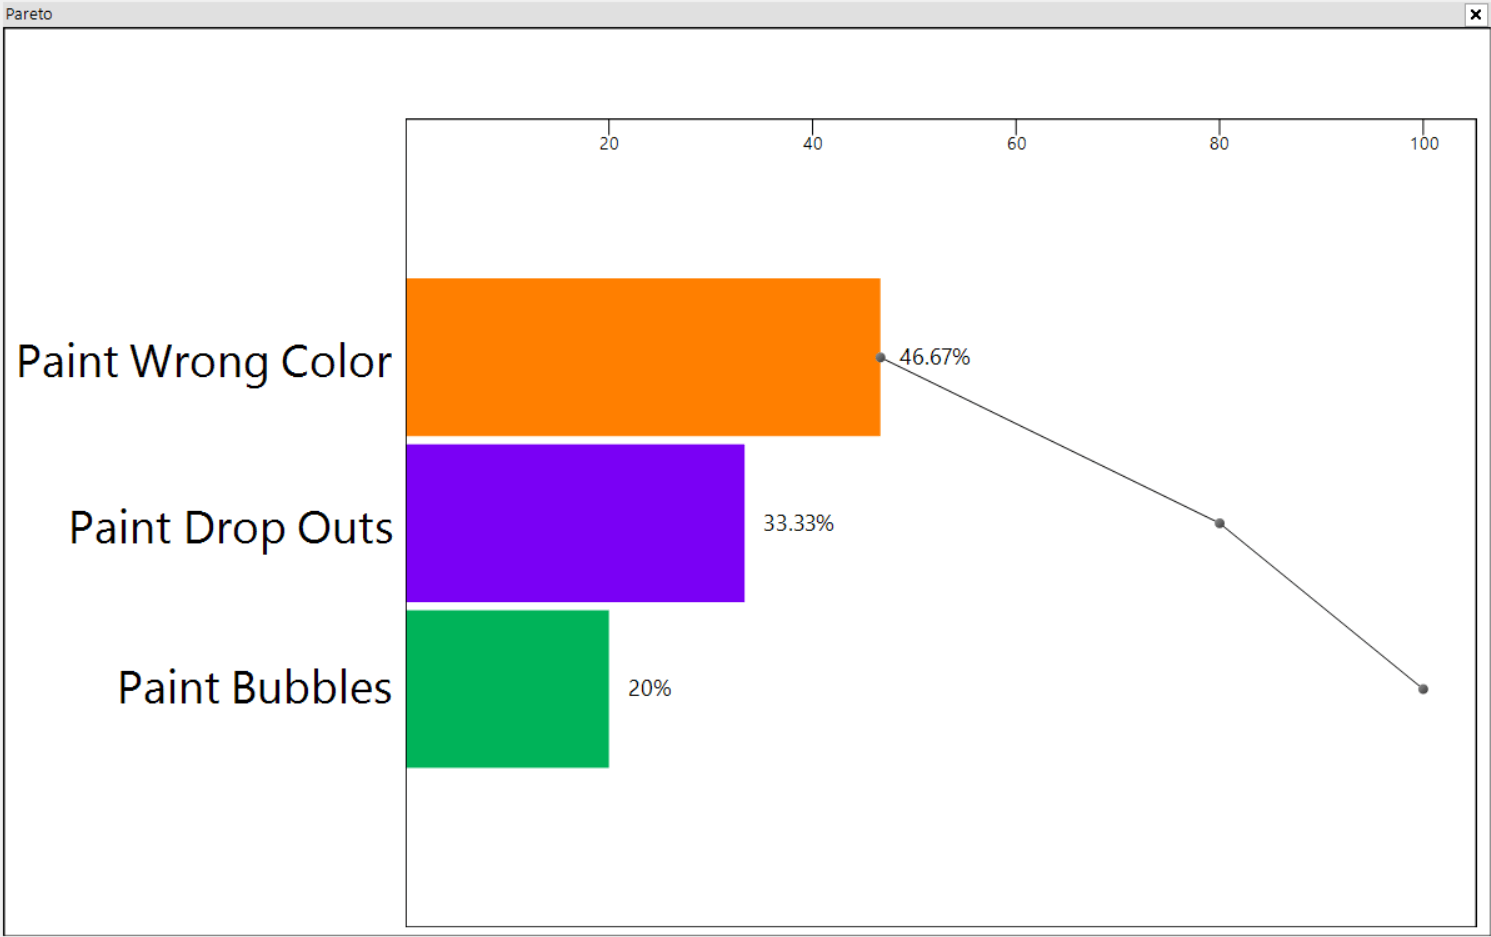
The pareto chart displays defect types as a fractional percentage of the entire defect population. This allows you to distinguish the “significant few” from the “trivial many”. The Pareto chart displays columns of fractional percentage as well as plot points of the cumulative percentage.
c chart, u chart, np chart, pie chart and tallysheet are also available.