The statistical tests are often referred to as Shewhart Tests or Western Electric Tests.
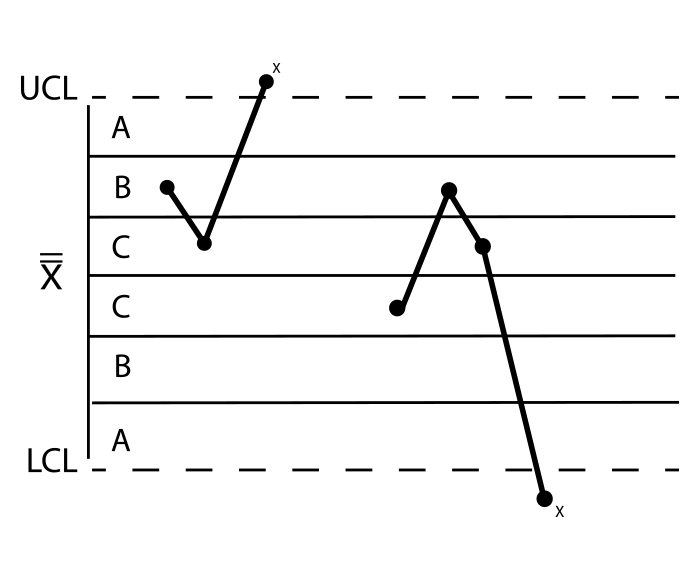
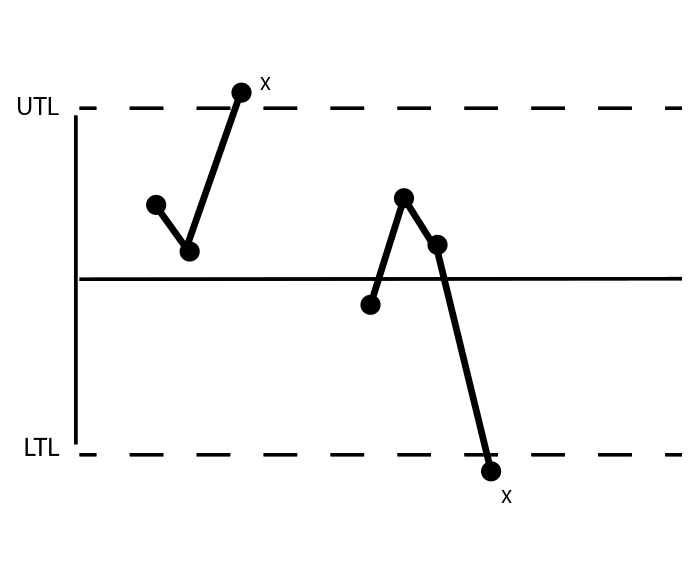
Subgroup average falls outside the control limits. This may indicate a shift in the process. For normally distributed random data this occurs rarely at 0.27% of the time.
Out of control condition – specified number of consecutive subgroup averages (typically 7, 8, 9) are all above or below the center line (overall average of the data). This may indicate a shift in the process.
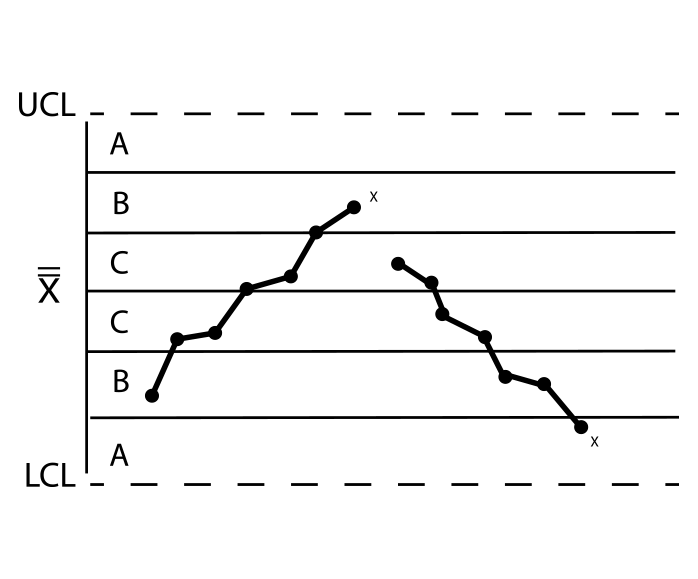
Out of control condition – specified number of consecutive subgroup averages (typically 6) are all increasing or decreasing in value. Neither the chart centerline nor the zones are considered. This could be a sign of tool wear. For normally distributed random data with 7 data points, all increasing or all decreasing occurs 0.28% of the time.
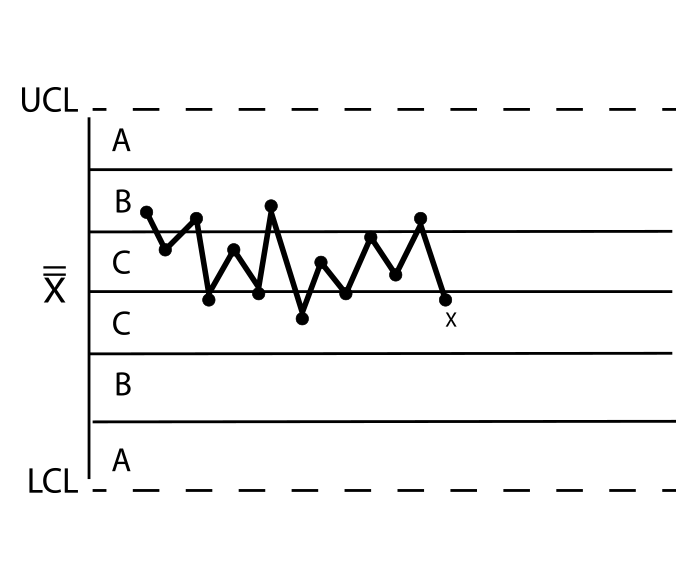
Out of control condition is when a specified number of consecutive subgroup averages (typically 14) alternate up and down. Neither the chart centerline nor the zones are considered. This may indicate trending toward out of control process. For data with a normal probability distribution this occurs 0.46% of the time.
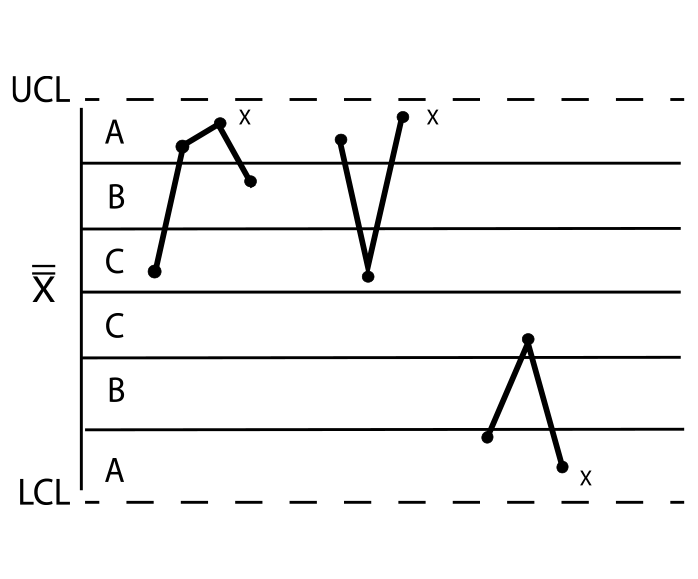
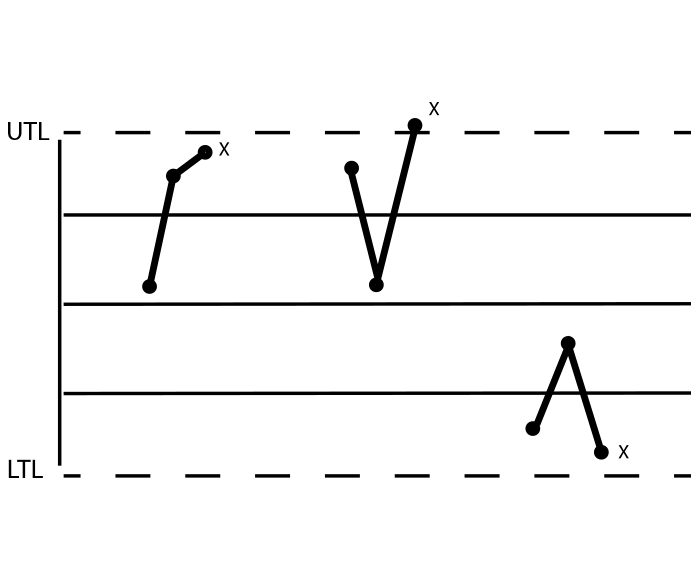
Out of control condition – 2 of 3 consecutive subgroup averages are in Zone A or beyond (2 standard deviations or beyond) on the same side of Center line (overall average) and the 3rd subgroup average is one of the faulting subgroups. This may indicate a shift in the process. For normally distributed random data this occurs 0.15% of the time.
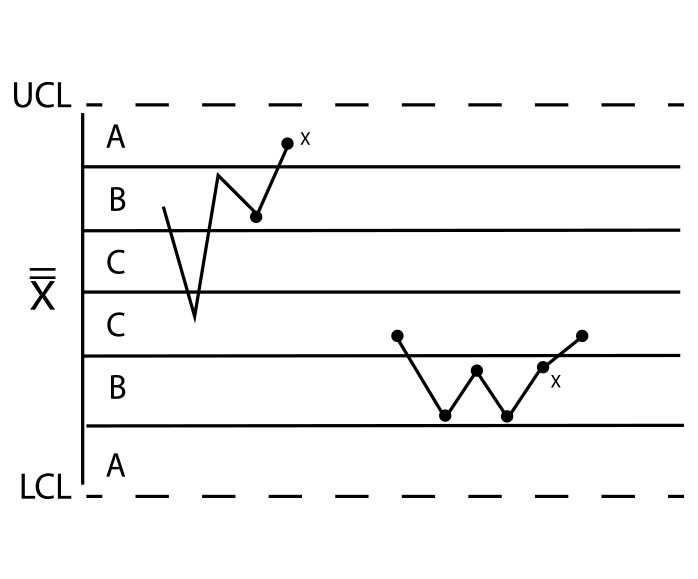
Out of control condition – 4 of 5 consecutive subgroup averages are in Zone B or beyond (1 standard deviation or beyond) on the same side of Center line (overall average) and the 5th subgroup average is one of the four faulting subgroups. This may indicate a shift in the process. For normally distributed random data this occurs 0.28% of the time.
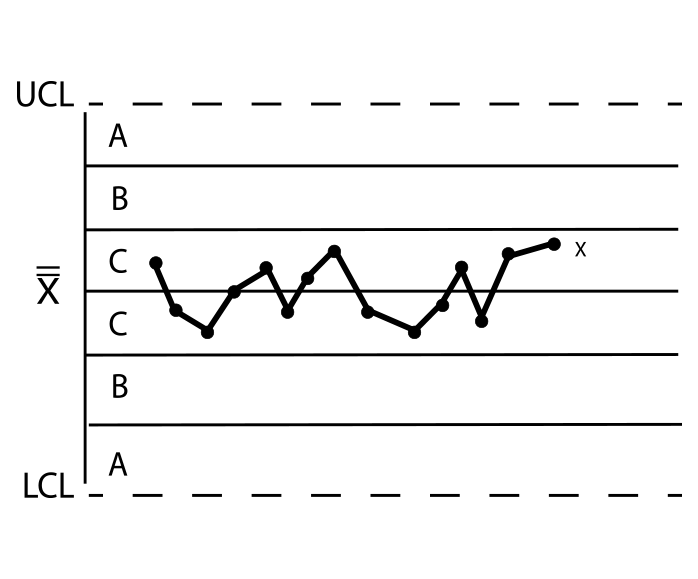
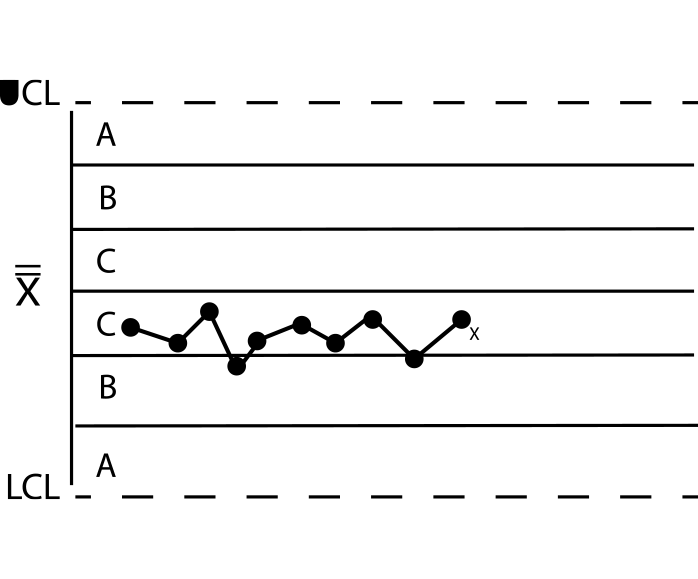
A specified number of consecutive subgroup averages (typically 15) are all within Zone C (within 1 standard deviation of overall average). This could indicate a reduction of variation in the process. For normally distributed random data 15 data points’ display oscillatory behavior 0.46% of the time.
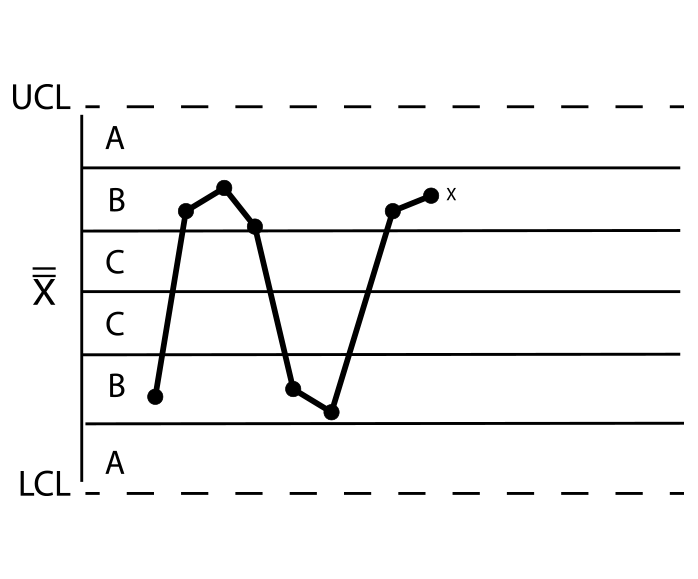
Out of control condition – specified number of subgroup averages (typically 8) are outside Zone C (outside 1 standard deviation of average) on both sides of the Center line (overall average). This may indicate multiple processes (e.g. multiple machines) being plotted on a single chart or hyper-adjustment of the process. For normally distributed random data 8 data points’ display oscillatory behavior 0.46% of the time.
This is not a control test, but a test of observations meeting specification.
Precontrol is not a control test, but based on specification. Green area is near target (nominal), Yellow outside Green area but still within specification, and Red outside of tolerance. Test failure is when a single observation falls within Red area or 2 of 3 consecutive observations are in Yellow and the last of the 3 is in Yellow. This test is typically used to alert Operator to re-center process.