Each observation measures one or more properties (such as size, location, weight, etc.) of observable characteristics distinguished as independent variables.
Sampling is that part of statistical practice concerned with the selection of a subset of individual observations within a population of individuals intended to yield some knowledge about the population of concern, especially for the purposes of making predictions based on statistical inference.
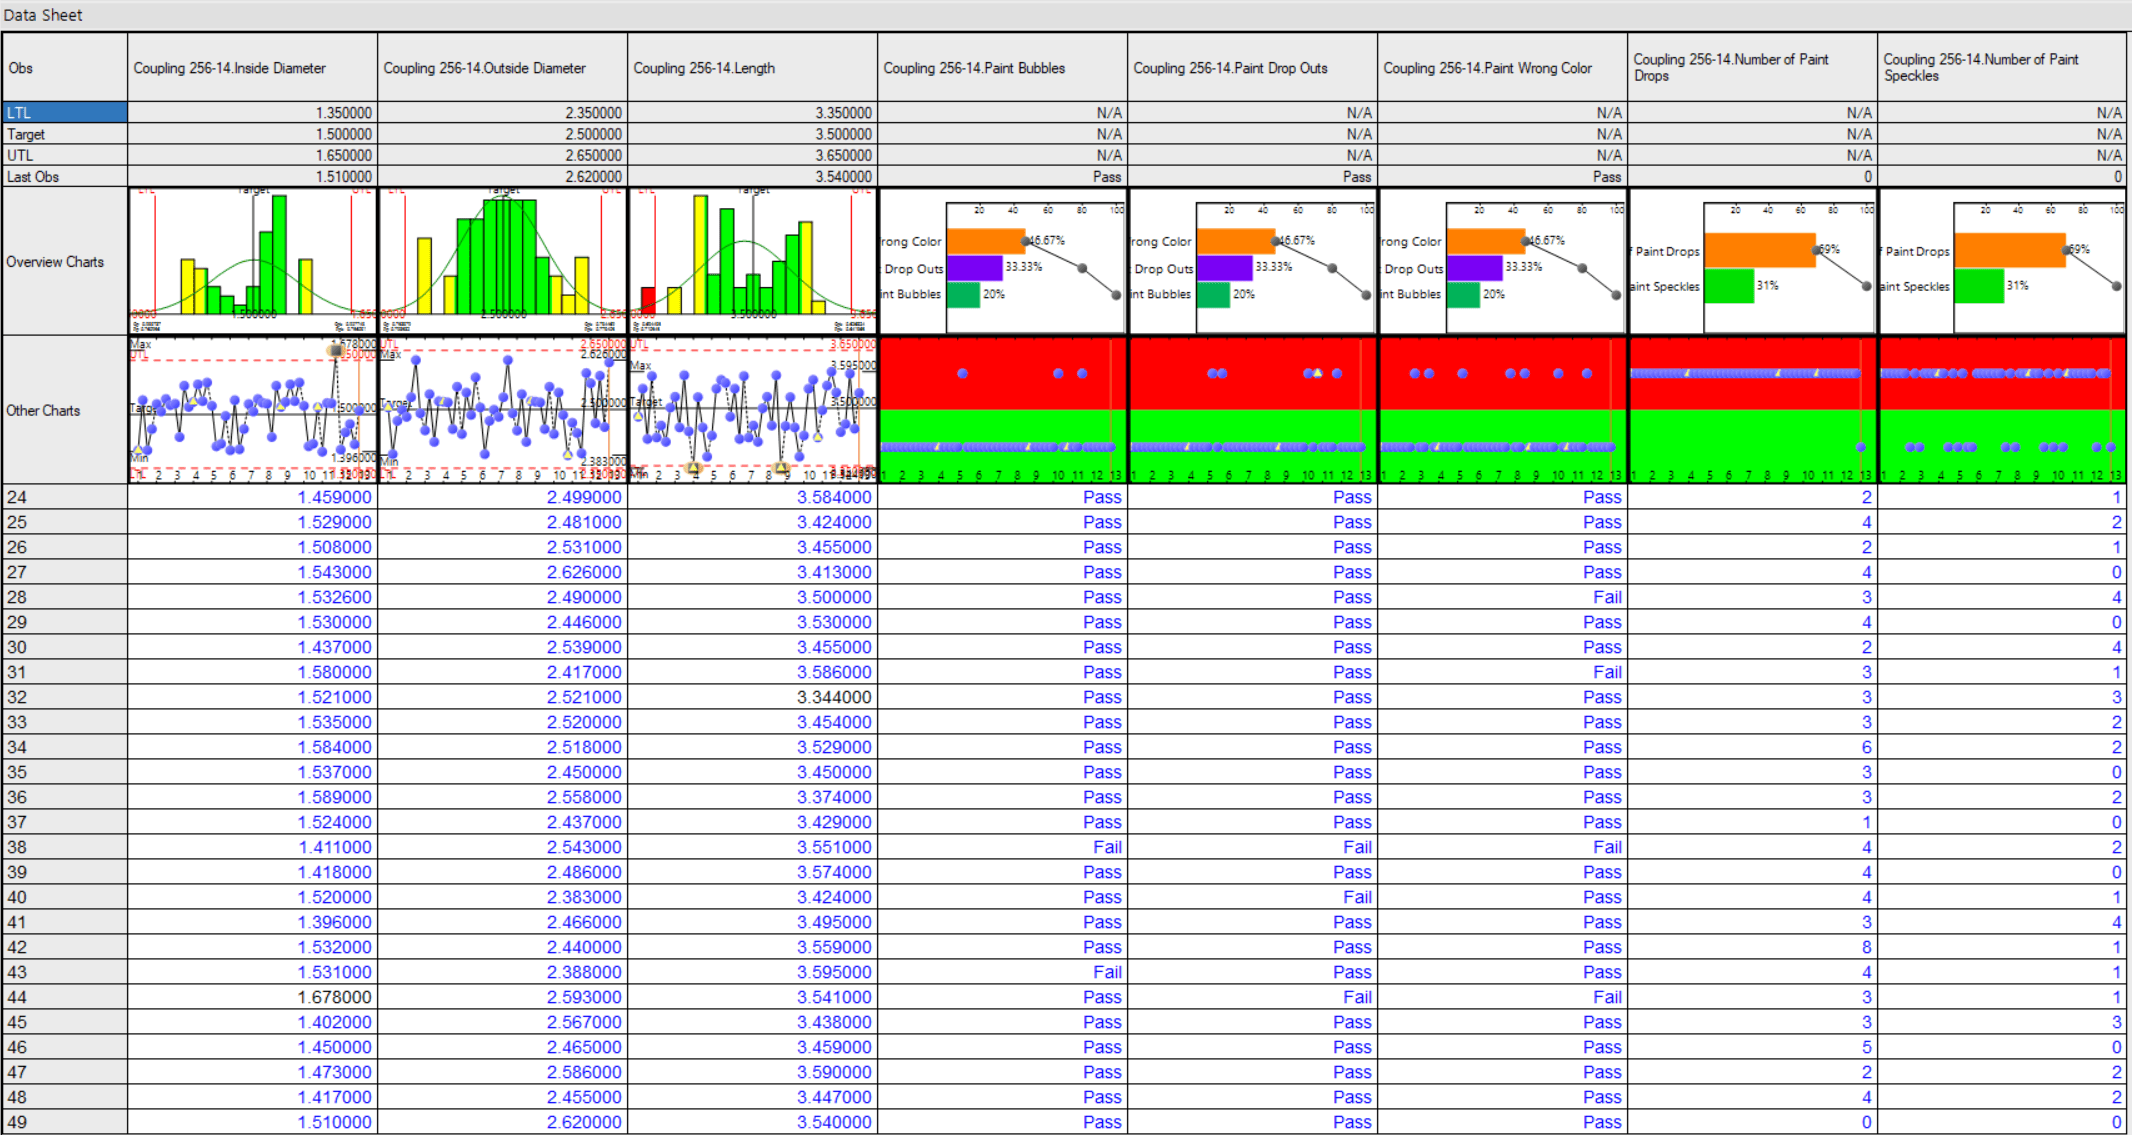
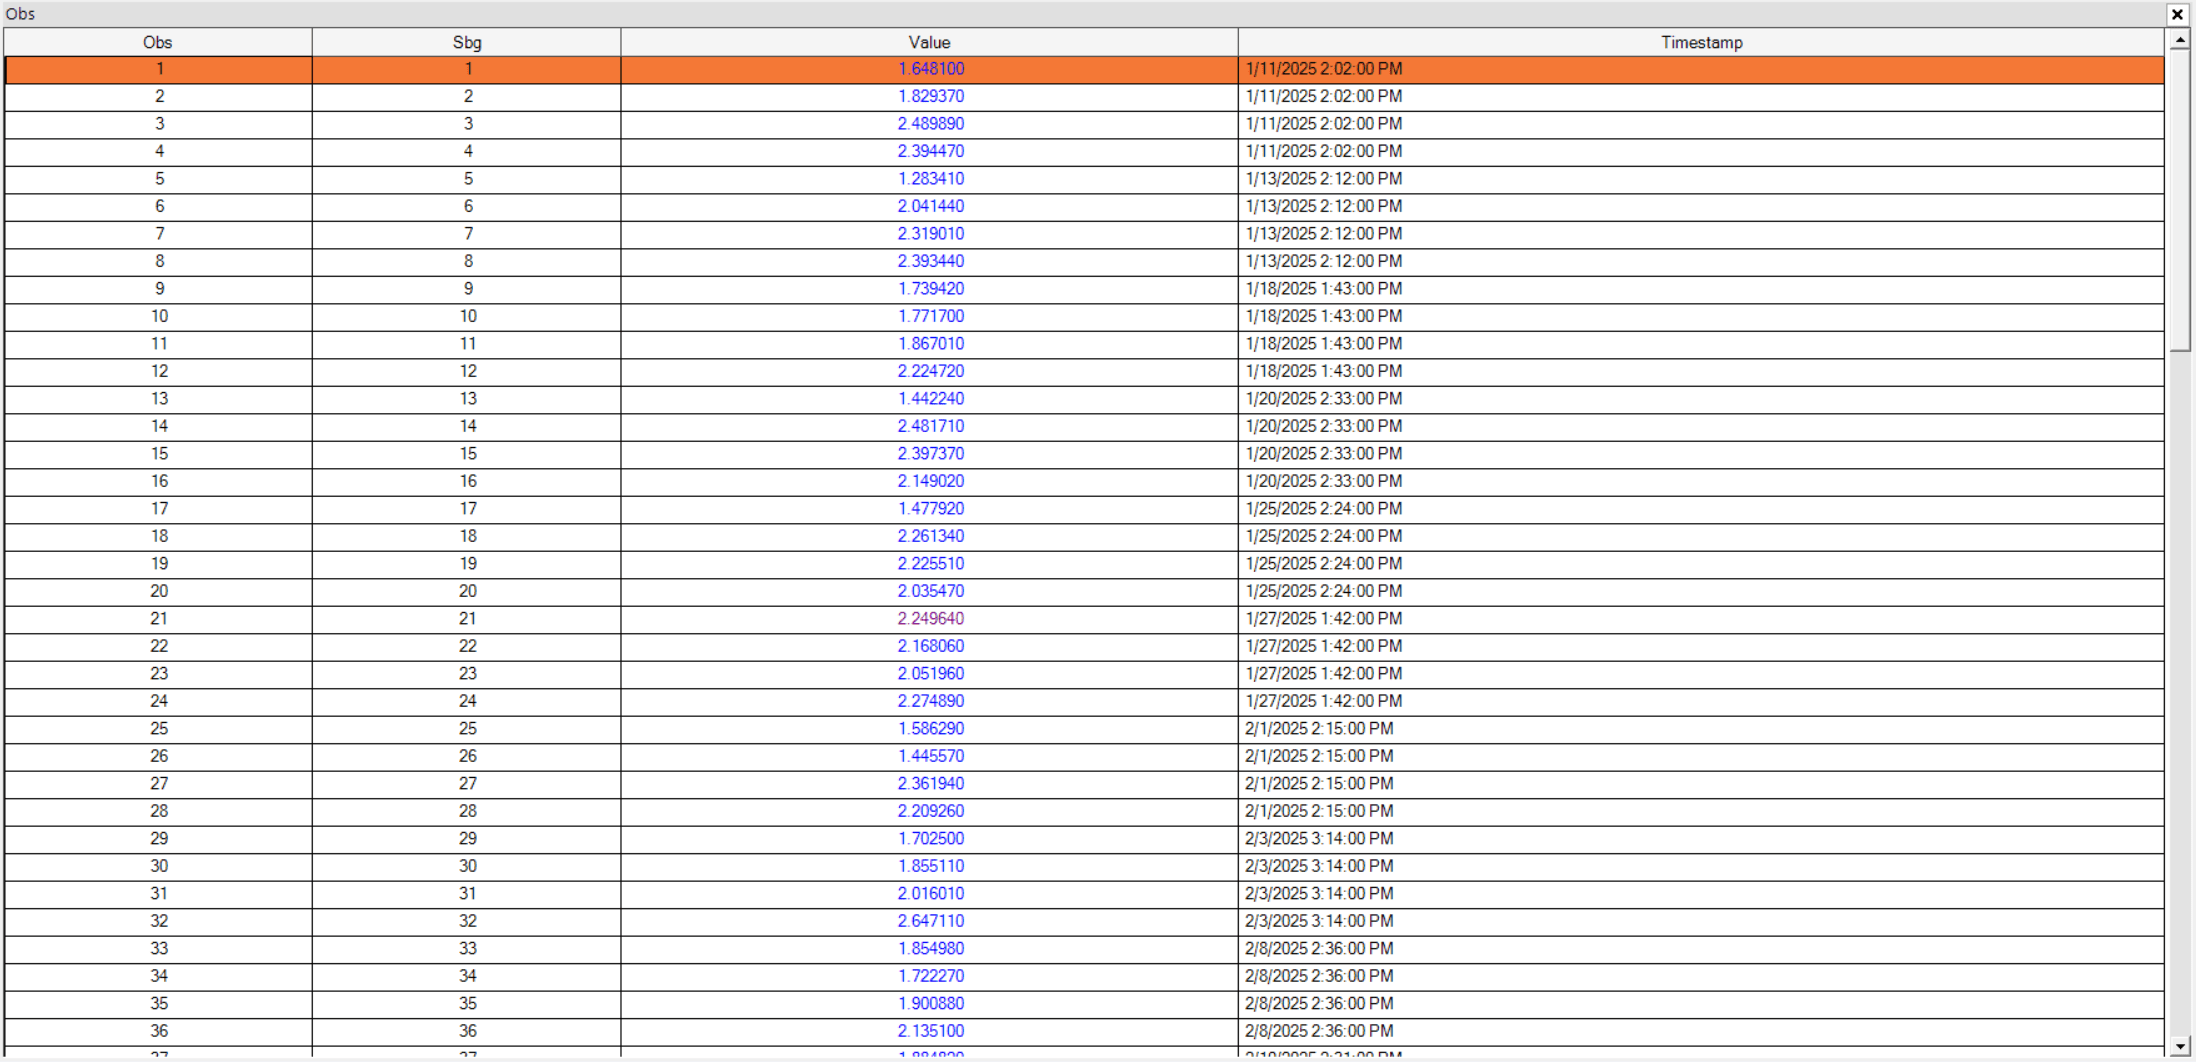
The Observation Chart shows the actual data values, their data/time stamp, and the subgroup the data is in. The Data Sheet organizes the observations per characteristic. These windows provide the operator with easy editing (if allowed).